Hello! Welcome to the sixth lesson in our module on Relative Valuation.
In our last lesson, we took the first crucial step in Precedent Transaction Analysis (PTA): learning how to search for and select a relevant universe of comparable M&A deals. We established that the prices paid in these deals often include a control premium, which is why PTA typically yields higher valuation ranges than Comparable Company Analysis (CCA).
Today, we move to the heart of the analysis. Your learning outcome is to calculate and standardize transaction multiples from precedent transactions, adjusting for control premiums. This means we'll take the raw data from the deals we've selected and transform it into the powerful valuation multiples that drive our analysis. You will learn how to calculate the true price paid for a company and how to adjust the multiples to ensure an "apples-to-apples" comparison.
1. From Deal Announcement to Transaction Value
When an M&A deal is announced, the price is often stated as a "price per share." Our first task is to convert this into the total Equity Value and Enterprise Value of the transaction. This process has some important nuances that differ from our work in CCA.
Calculating Transaction Equity Value
In CCA, we used the current market capitalization. For a precedent transaction, we use the offer price.
Transaction Equity Value = Offer Price per Share × Fully Diluted Shares Outstanding
The key here is "Fully Diluted Shares Outstanding." In an acquisition, the acquirer must account for all potential shares that could be created from securities like stock options and convertible bonds.
To understand this calculation in detail, let's turn to a video that walks through the key components.
Precedent Transactions Analysis – CH 2 Investment Banking Valuation Rosenbaum
The video 'Precedent Transactions Analysis' by FinanceKid provides an excellent breakdown of how to calculate equity value in an M&A context. It's based on the industry-standard Rosenbaum & Pearl textbook, aligning with your goal for 'Ivy League quality' material.
Watch the segment from 20:23 to 27:16. Pay close attention to: Fully Diluted Shares: How the Treasury Stock Method (TSM) and If-Converted Method are used. Key Difference in PTA: The video explains that for transactions, you include all outstanding in-the-money options (vested and unvested), because the acquirer is taking on this future liability. This is a critical distinction from CCA.
Purchase Consideration: Cash, Stock, or a Mix?
The way an acquirer pays for the target—the purchase consideration—also affects the calculation.
- All-Cash: This is the most straightforward. The offer price is a simple dollar value.
- Stock-for-Stock: The acquirer pays with its own shares. The value can be based on a fixed exchange ratio (e.g., you get 0.5 shares of AcquirerCo for every 1 share of TargetCo) or a floating exchange ratio (the ratio adjusts to deliver a fixed dollar value).
- Cash and Stock Mix: A combination of both.
Understanding these structures is essential for correctly determining the offer price.
Precedent Transactions Analysis – CH 2 Investment Banking Valuation Rosenbaum
Let's continue with the same video, which now explains how to handle different forms of purchase consideration.
Watch from 27:16 to 33:06. Focus on how the offer price is determined in a stock-for-stock transaction using an exchange ratio. You don't need to master the nuances of fixed vs. floating today, but understand the concept.
Calculating Transaction Enterprise Value
Once you have the Transaction Equity Value, calculating the Transaction Enterprise Value (EV) is familiar.
Transaction EV = Transaction Equity Value + Net Debt (as of the deal announcement)
Remember, Net Debt = Total Debt + Preferred Stock + Non-Controlling Interest - Cash. The critical point is that we're using the transaction equity value, which already includes the control premium.

2. Standardizing the Multiples
For our multiples to be comparable, both the numerator (EV) and the denominator (e.g., EBITDA) must be standardized.
The Denominator: LTM Financials
For precedent transactions, we almost always use LTM (Last Twelve Months) financial figures as of the transaction announcement date. It is very difficult to find reliable forward-looking projections for acquired companies, and even when available, they may be inconsistent (e.g., some might include synergies, others might not).
Adjusting for Non-Recurring Items
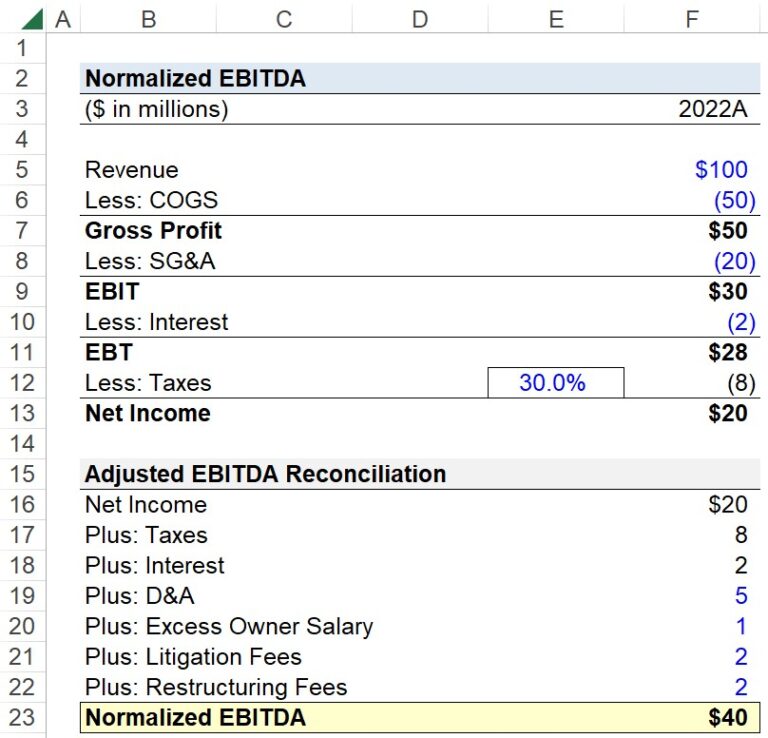
Just as with CCA, we must "normalize" the LTM financial data. This means adjusting metrics like EBITDA for any one-time or non-recurring expenses or income to reflect the company's true, ongoing profitability.
Adjusted EBITDA = Reported EBITDA + Non-Recurring Expenses - Non-Recurring Income
3. Adjusting for Premiums and Synergies
Now we arrive at the most analytical part of our task: understanding and adjusting for the specific dynamics of an M&A deal.
Calculating the Control Premium
In the last lesson, we introduced the control premium. Now, let's formalize its calculation. The premium is the percentage by which the offer price exceeds the target's unaffected share price—that is, its stock price before rumors of the deal began to influence trading.
Control Premium | Formula + Calculator
The article 'Control Premium' from Wall Street Prep provides a clear and concise definition and formula for this concept.
Read the sections 'What is Control Premium?', 'Control Premium Formula', and 'Control Premium Calculation Example'. Focus on the formula and the importance of using the 'Unaffected' share price.
The formula is:
Analysts typically look at the share price 1-day, 1-week, and 1-month prior to the announcement to determine a fair unaffected price.
Calculating Transaction Multiples
With the Transaction EV (numerator) and the standardized LTM financials (denominator), we can calculate the multiples. Common examples include:
- EV / LTM Revenue
- EV / LTM EBITDA
- Equity Value / LTM Net Income (P/E)
Precedent Transactions Analysis – CH 2 Investment Banking Valuation Rosenbaum
Let's watch a final clip that brings these concepts together, explaining the common multiples and, crucially, how to think about adjusting for synergies.
Watch from 33:06 to 41:16. This is a very important section. Pay close attention to: The list of common transaction multiples. The definition of synergies (cost savings, growth opportunities). The example of how to calculate a synergy-adjusted multiple. This is a key technique for standardizing transaction multiples.
Adjusting for Synergies
As the video explained, a strategic buyer pays a price that reflects not just the target's standalone value, but also the value of the synergies it expects to create. To standardize multiples across deals with different synergy potentials, an analyst can calculate a synergy-adjusted multiple.
Synergy-Adjusted Multiple = Transaction EV / (LTM EBITDA + Expected Annual Cost Synergies)
This adjusted multiple shows the price paid relative to the future, combined earnings power of the business. It is often lower than the unadjusted multiple and gives a better sense of the "true" valuation of the standalone business plus the value attributed to synergies.
Test your understanding!
An acquirer makes an offer to buy TargetCo. Here is the relevant data:
- Offer Price: $30 per share
- Unaffected Share Price (1-week prior): $24 per share
- Fully Diluted Shares Outstanding: 50 million
- Net Debt: $400 million
- LTM EBITDA: $150 million
- Expected Annual Synergies: $25 million
Based on this, calculate:
- The control premium.
- The Transaction Enterprise Value (EV).
- The unadjusted EV / LTM EBITDA multiple.
- The synergy-adjusted EV / LTM EBITDA multiple.
Show answer
-
Control Premium:
($30 / $24) - 1 = 1.25 - 1 = 25% -
Transaction Enterprise Value (EV):
- Transaction Equity Value = $30/share * 50 million shares = $1,500 million
- Transaction EV = Equity Value + Net Debt = $1,500M + $400M = $1,900 million
-
Unadjusted EV / LTM EBITDA Multiple:
- $1,900M EV / $150M EBITDA = 12.7x
-
Synergy-Adjusted EV / LTM EBITDA Multiple:
- $1,900M EV / ($150M EBITDA + $25M Synergies) = $1,900M / $175M = 10.9x
Notice how adjusting for synergies provides a lower, more "normalized" multiple.
Conclusion
You have now mastered the mechanics of turning raw deal data into standardized, insightful valuation multiples. This process goes far beyond simple division; it requires a careful understanding of how transaction value is constructed and how to adjust for deal-specific factors.
Key Takeaways:
- Transaction Value: Enterprise Value in a PTA is based on the offer price, not the historical market price, and therefore incorporates the control premium.
- Standardization: To ensure comparability, you must use LTM financials as of the deal date and normalize metrics like EBITDA for non-recurring items.
- Control Premium: This is a quantifiable premium over the unaffected share price that reflects the value of control.
- Synergy Adjustments: A sophisticated analyst will adjust multiples for expected synergies to better understand the underlying valuation paid for the standalone business.
Preview of the Next Lesson:
So far in this module, we have built two distinct sets of multiples: one from living, breathing public companies (CCA) and one from historical M&A deals (PTA). In our next lesson, we will use the range of multiples from trading comps and precedent transactions to derive an implied valuation for the target company. This is where we bring everything together to create the final valuation range and the famous "football field" chart.