Hello! Welcome back to our final module on Business Intelligence.
In our last lesson, we dove into the "engine room" of Power BI, learning to write the DAX measures that perform our financial calculations. You learned how to create KPIs like Revenue and Gross Profit, and how to use the powerful CALCULATE function to control the context of these calculations.
Today, we'll step out of the engine room and into the cockpit. We will use those DAX measures to build the visual, interactive dashboard that business leaders will use to make decisions. This lesson is the culmination of your work in Power BI, bringing together data modeling, DAX, and visualization principles.
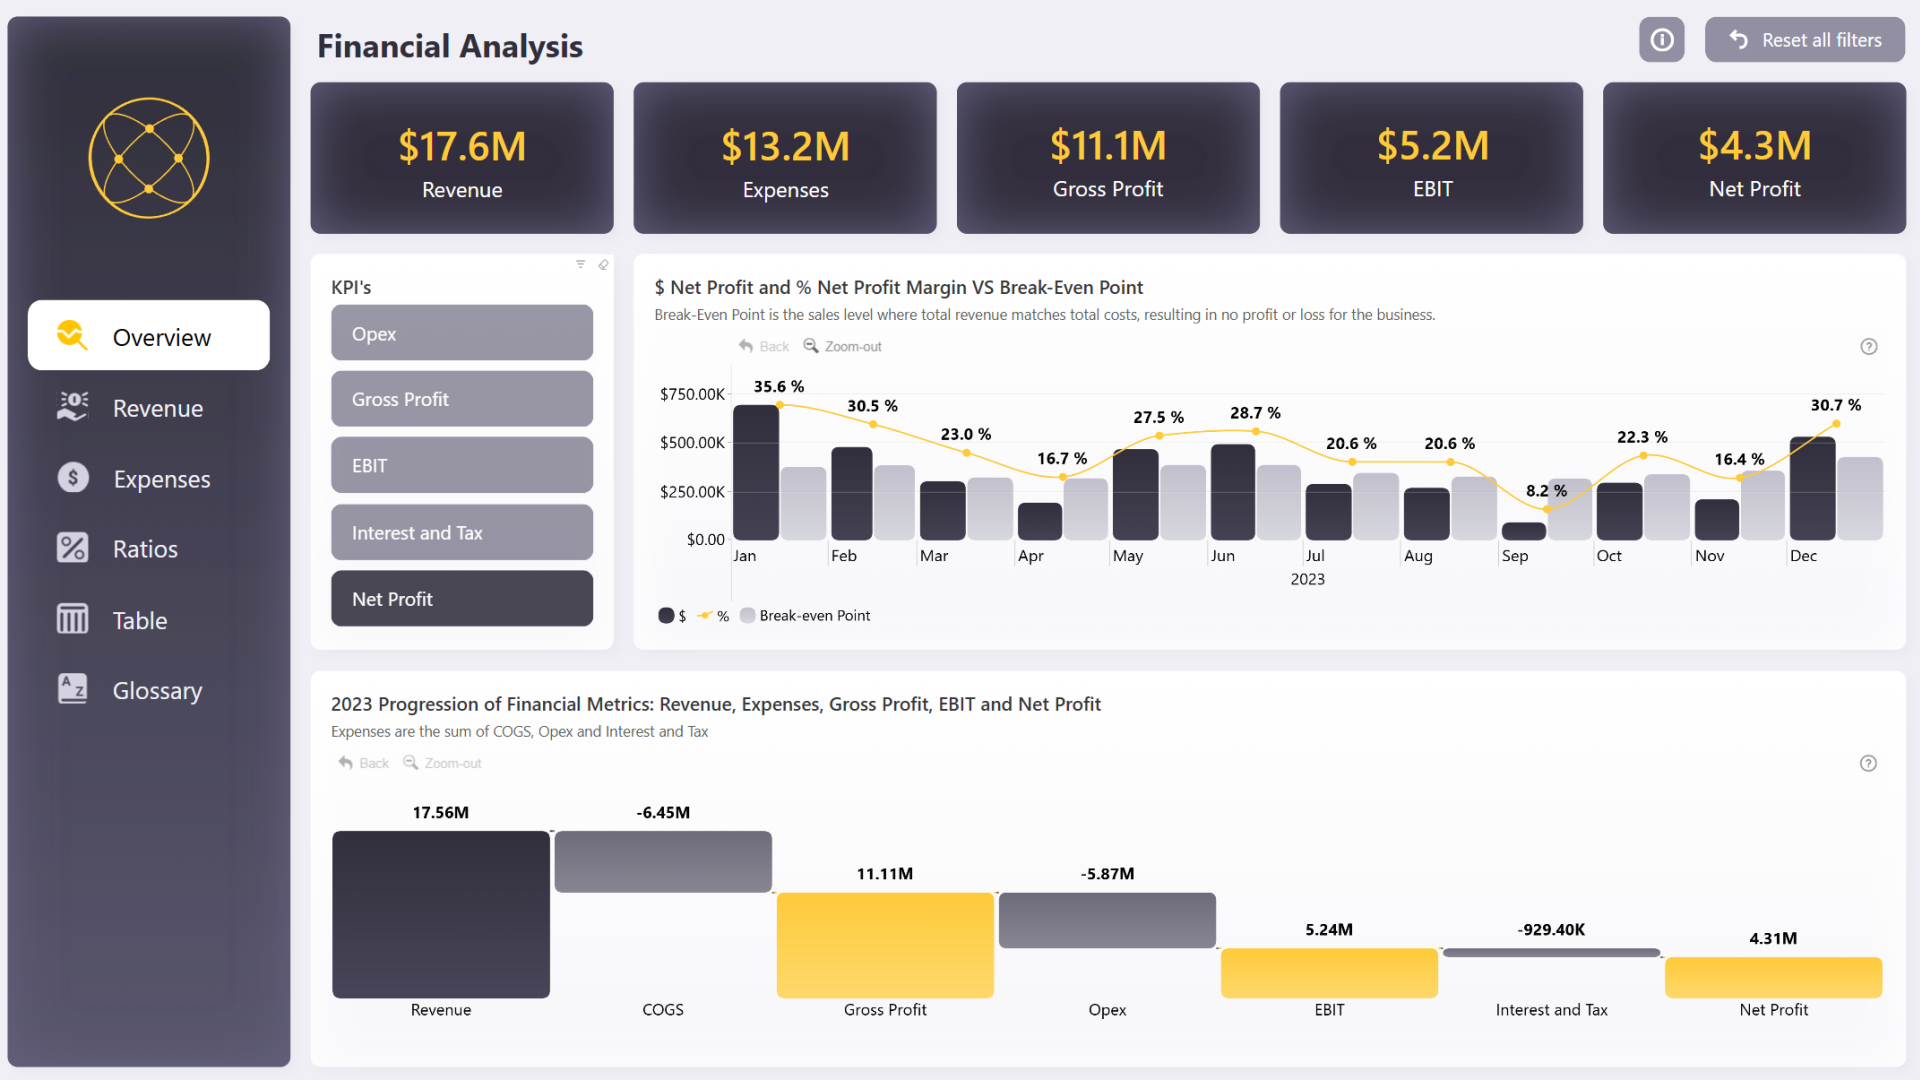
Our goal is to build an interactive FP&A dashboard in Power BI featuring waterfall charts, variance charts, and KPI cards. These three components are the bedrock of modern financial reporting and will be central to your work as an FP&A analyst.
1. The Anatomy of an FP&A Dashboard
A great dashboard tells a clear story, starting with the headlines and then allowing the user to drill into the details. The components we're building today serve distinct purposes in that story.
-
KPI Cards: These are the big numbers at the top of a dashboard. They provide an immediate, at-a-glance summary of the most critical metrics (e.g., Total Revenue, Net Profit, EBITDA). They are designed for quick consumption by executives. In Power BI, you create these using the "Card" visual and simply drag one of your DAX measures into it.
-
Variance Charts: The core of FP&A is analyzing performance against a benchmark—be it the budget, the forecast, or the prior year. Variance charts visualize these differences. A simple column chart showing
Actual vs. Planis a variance chart. We'll explore how to make them more insightful. -
Waterfall Charts: These are exceptionally powerful visuals for finance. They are used to show how a starting value is affected by a series of intermediate positive and negative values, arriving at an end value. There are two primary uses in FP&A:
- Composition: Explaining the components of a total. For example, showing how Revenue is reduced by COGS and Opex to arrive at Net Income.
- Attribution (or "Bridge"): Explaining the change in a metric between two periods. For example, showing what drove the change in profit from Q1 to Q2.
2. Assembling the Core Financial Statements
Before we build fancy charts, we need to present the foundational financial statements in a clear, structured way. The best tool for this in Power BI is the Matrix visual, which functions like a super-powered Excel PivotTable.
Let's walk through how to construct the views for the P&L, Balance Sheet, and Cash Flow statement.
Building an FP&A Dashboard (Power BI Tutorial + Template)
The following article provides an excellent, practical guide to building out the actuals analysis section of an FP&A dashboard. We will focus on the first part, which lays out the financial statements.
Please read the section titled 'Step 6a. Building the Financial Statements Power BI Dashboard'. Pay close attention to how the Matrix visual is configured for each of the three statements (P&L, Cash Flow, Balance Sheet) by using different fields on the rows, columns, and values.
As you've read, the process is systematic:
- Create a Page for Actuals: Start by creating a new report page. A key best practice is to use the Filter pane to apply a page-level filter (e.g.,
Calendar[IsActual] = True) to ensure every visual on that page only shows historical data. - Build the P&L:
- Visual:
Matrix - Rows: Your P&L account dimension (e.g.,
DimPL_Account[Account]) - Columns: A time dimension (e.g.,
Calendar[MonthStart]) - Values: Your primary P&L measure (e.g.,
[PL Amount])
- Visual:
- Build the Cash Flow and Balance Sheet: You repeat the process, simply swapping the fields in the
RowsandValueswells with the appropriate dimensions and measures for each statement (e.g.,DimCF_Category[Category]and[CF Amount]).
This structure provides a familiar, report-style layout that is the foundation of any FP&A pack.
3. Visualizing Performance: Variance and Waterfall Charts
With our core statements in place, we can now create visuals that tell a story about performance. We'll go beyond basic charts by incorporating principles from the International Business Communication Standards (IBCS), a set of best practices that will elevate the quality and clarity of your reports—something you highlighted as important in your goals.
Creating Effective Variance Charts
Variance analysis is more than just subtracting Plan from Actual. The key is to communicate whether a variance is "good" or "bad." For example, being over budget on revenue is good (green), but being over budget on expenses is bad (red).
Building IBCS compliant reports in Power BI
This resource provides an excellent introduction to IBCS principles for visualizing variances.
Please read the section '8. Variance and percentage variance'. Focus on the concept of classifying variances as 'good' or 'bad' and the associated use of color (green and red).
To apply this in Power BI:
- Create a measure for your variance, e.g.,
Revenue Variance = [Actual Revenue] - [Planned Revenue]. - Add a Clustered Bar or Column chart to your report.
- Place your category (e.g., Product Line) on the Y-axis and your
[Revenue Variance]measure on the X-axis. - In the Format visual pane, under Bars > Color, use the Conditional formatting (fx) option. You can set up a rule:
- If value is greater than or equal to 0, color is green.
- If value is less than 0, color is red.
For an expense variance, you would simply reverse this logic. This simple technique immediately makes your charts more intuitive for business users.
Building Powerful Waterfall Charts
Waterfall charts are perfect for explaining a P&L or bridging results between periods.
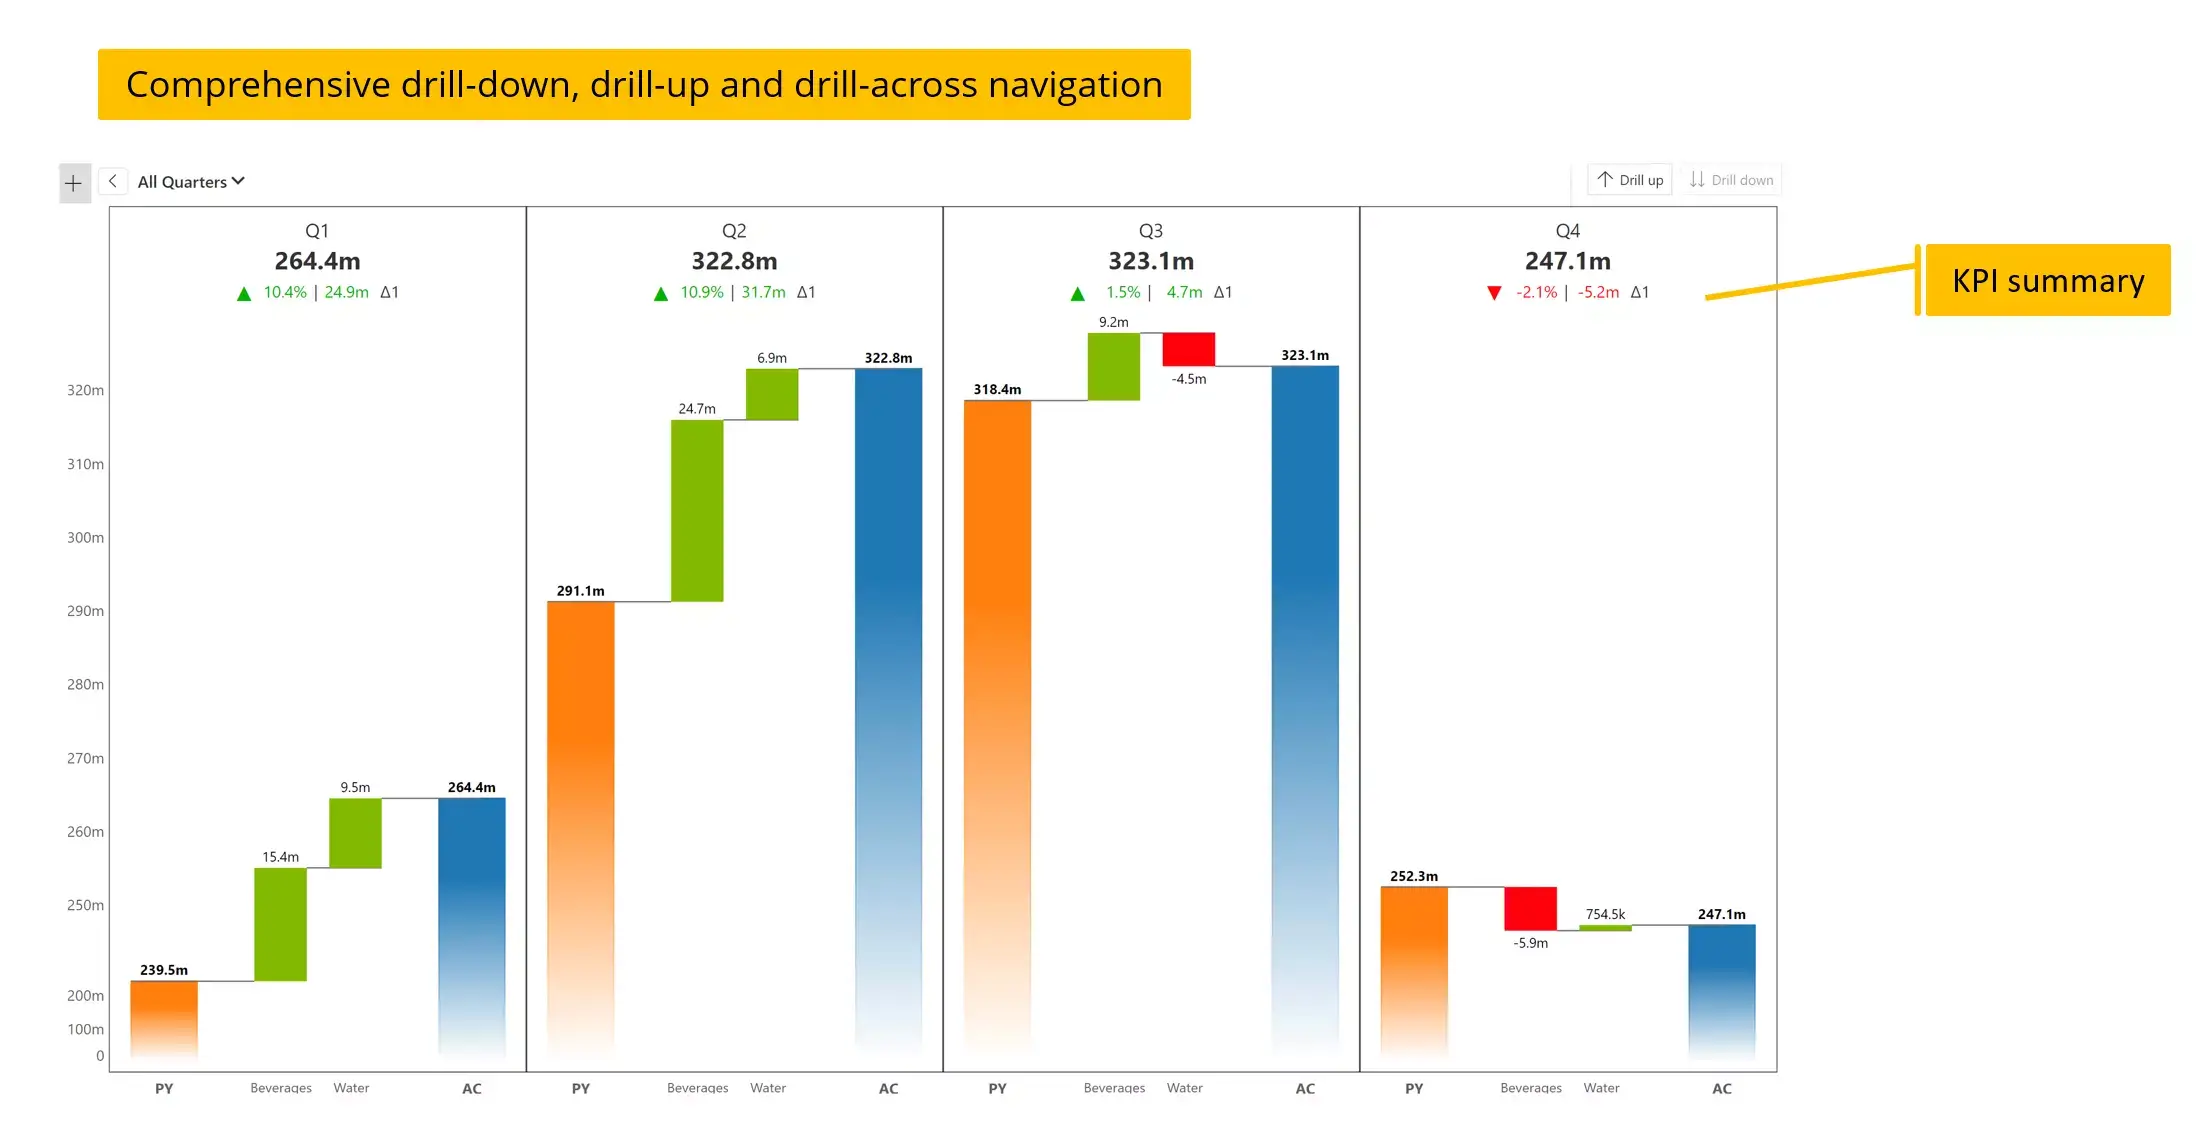
The resource on IBCS gives a great overview of different waterfall chart applications. We'll focus on the most common one for an income statement.
Building IBCS compliant reports in Power BI
Let's now look at how to construct a waterfall chart, specifically for an income statement.
First, review the 'Vertical waterfall chart' section to understand its application for income statements. Then, review the step-by-step guide under '7. Creating IBCS charts in Power BI > Vertical waterfall chart'. While it uses a custom visual, the core steps (adding a category and a value, then defining totals) are the same for Power BI's native waterfall chart.
To build an income statement waterfall chart in Power BI using the native visual:
- Add a Waterfall chart visual to your canvas.
- Drag your P&L account dimension (
DimPL_Account[Account]) to the Category field. Make sure the accounts are sorted in the correct P&L order in your data model. - Drag your
[PL Amount]measure to the Values field. - Power BI will automatically create the waterfall. You will likely need to manually designate subtotals. For example, click on the "Gross Profit" bar in the chart, and in the formatting pane, toggle it to be a "Total". Do the same for "Net Income". This tells Power BI to restart the cumulative calculation from that point.
Test your understanding!
You are asked to create a visual that clearly explains how your company's Net Income is derived from Revenue for the last fiscal year. You need to show the impact of COGS and Operating Expenses. Which visual would be the most effective and why?
a) A Pie Chart showing the percentage contribution of each P&L line.
b) A Waterfall Chart showing Revenue as the start, then the negative impacts of COGS and Opex, ending with Net Income.
c) A Line Chart tracking Revenue, Opex, and Net Income over the 12 months.
Show answer
The correct answer is (b) A Waterfall Chart.
A pie chart is poor for this because it doesn't handle negative values well and doesn't show the sequential flow. A line chart is good for showing trends over time, but it doesn't clearly illustrate how the final Net Income figure is calculated from the other components at a single point in time (the full year). A waterfall chart is specifically designed to visualize this cumulative build-up or breakdown.
4. Making the Dashboard Interactive
The final step is to empower your users to explore the data themselves. This is done primarily through Slicers. Slicers are on-canvas filters that allow users to dynamically change the context for all visuals on the page.
Building an FP&A Dashboard (Power BI Tutorial + Template)
Let's return to the dashboard tutorial to see how interactivity is added to a forecasting dashboard. The principles are the same for any dashboard.
Briefly read the 'Parameters' subsection within 'Step 8a. Building the Profit & Loss Forecast Dashboard'. Notice how 'Slicer' visuals are added for different fields like 'Calendar[Year]' and various forecast assumptions. This is the key to interactivity.
By adding slicers for common dimensions like Year, Quarter, Department, or Region, you transform a static report into a dynamic analysis tool. When a user selects "2024" in a Year slicer, all of your visuals—the KPI cards, matrices, variance charts, and waterfall charts—will instantly filter to show data only for 2024. This interactivity is what makes Power BI so valuable for FP&A.
Conclusion
Congratulations, you have now learned how to assemble a professional-grade FP&A dashboard! You have bridged the gap between raw data and actionable insight, a critical skill for any financial analyst.
Key Takeaways:
- A standard FP&A dashboard consists of KPI cards for headlines, variance charts for performance analysis, and waterfall charts for explaining composition and change.
- The Matrix visual is the workhorse for creating structured financial statement reports within Power BI.
- Incorporate IBCS principles like "good" vs. "bad" color-coding in variance charts to improve clarity.
- Use the native Waterfall chart visual to clearly explain how P&L items contribute to the bottom line or to bridge results between periods.
- Slicers are the key to making your dashboard interactive, allowing users to filter and explore the data on their own.
Preview of the Next Lesson:
Your dashboard is built, but it currently only exists on your computer. To deliver value, it needs to be in the hands of your stakeholders. In our final lesson, Publish and share Power BI reports for consumption by business stakeholders, we will cover the process of publishing your report to the Power BI service and managing how it's shared and viewed by the organization.