Hello! Welcome to the next lesson in your FP&A training.
In our last session, we constructed the architectural "skeleton" of our Power BI report by building a star schema and creating relationships between our data tables. This structure is essential for data integrity and performance. However, a skeleton can't do much on its own. Today, we'll add the "muscle" by learning to write basic formulas in Data Analysis Expressions (DAX).
This lesson directly addresses the learning outcome: Write basic DAX measures to create custom calculations and key performance indicators (KPIs). DAX is the formula language used across Power BI and Excel's Power Pivot. Mastering its fundamentals is non-negotiable for an FP&A analyst who wants to move beyond static spreadsheets and build dynamic, insightful reports. We'll start with the core concepts and build towards writing the essential financial metrics you'll use daily.
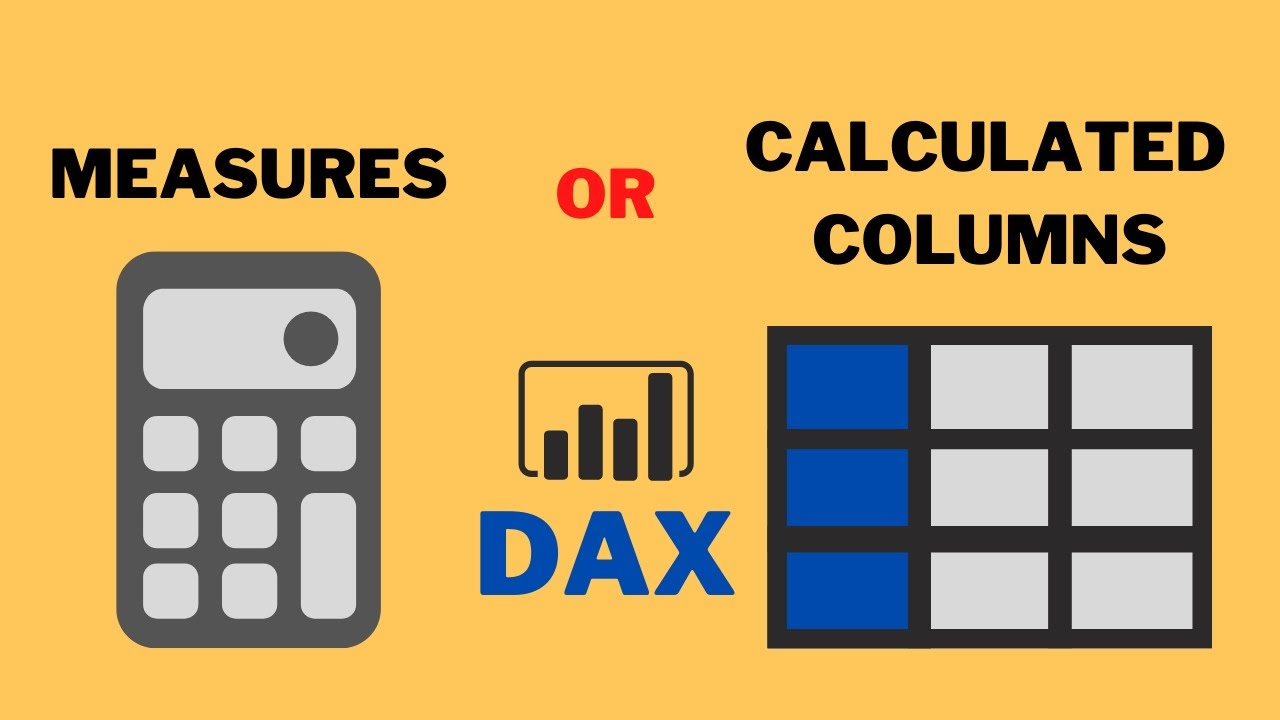
1. What is DAX? Measures vs. Calculated Columns
Think of DAX as a super-powered version of Excel formulas. While many functions will feel familiar (SUM, AVERAGE, IF), DAX is designed to work with entire tables and columns of data within the relational model you built in the last lesson.
Before writing any DAX, you must understand the two primary ways DAX calculations are stored: Calculated Columns and Measures. Getting this distinction right from the start will save you countless hours of confusion.
-
Calculated Columns: A calculated column creates a new column in one of your tables. The formula is evaluated for each row in the table during data refresh and the results are stored in your model.
- When to use: For static, row-level logic. For example, if you have a
Salestable withRevenueandCostcolumns, you could create a calculated columnGross Profit Amount = Sales[Revenue] - Sales[Cost]. This calculates the profit for each individual transaction. It's useful for categorizing or segmenting data that you'll use later in filters or slicers. - Cost: They consume memory (RAM) because the results are stored.
- When to use: For static, row-level logic. For example, if you have a
-
Measures: A measure is a formula for an aggregation. It doesn't store any values in your model. Instead, it is calculated on-the-fly whenever you add it to a visual in your report. The calculation responds dynamically to the context of the visual (e.g., filters, slicers, rows, and columns).
- When to use: For aggregated results and KPIs. For example, a measure
Total Revenue = SUM(Sales[Revenue])calculates the sum of revenue for whatever context is active—total company, a specific year, a single product, etc. This is the primary tool for FP&A. - Cost: They consume processing power (CPU) at query time.
- When to use: For aggregated results and KPIs. For example, a measure
For your FP&A work, you will be creating measures about 95% of the time.
For a deeper dive into these core concepts, the creators of DAX have an excellent free introductory course. Watching the first few videos will solidify your foundational understanding.
Navigate to the 'Introduction to DAX' section of the curriculum. Please review the short lectures on 'What is DAX?', 'Calculated Columns', and 'Measures'. This will provide a strong conceptual foundation before we start writing our own formulas.
2. Your First Measures: Simple Aggregations and Arithmetic
Let's start by creating some simple measures. The syntax is straightforward: Measure Name = FUNCTION(TableName[ColumnName]). In Power BI, you can create a new measure by right-clicking on any table in the 'Data' pane and selecting 'New measure'. A best practice is to create a dedicated, empty table to hold all your measures to keep your model organized.
The most common DAX functions are simple aggregations you already know from Excel:
SUM(): Adds up all the numbers in a column.AVERAGE(): Calculates the arithmetic mean.COUNT(): Counts the number of rows in a column.DISTINCTCOUNT(): Counts the number of unique values in a column.
Once you have a few base measures, you can combine them using standard arithmetic operators (+, -, *, /) to create KPIs. This is a powerful feature: measures can refer to other measures.
// First, create base measures for revenue and cost
Total Revenue = SUM(Financials[Amount])
Total COGS = SUM(Financials[Cost])

// Now, create a KPI by referencing the other measures
Gross Profit = [Total Revenue] - [Total COGS]
Notice how [Gross Profit] is more readable and modular than writing SUM(Financials[Amount]) - SUM(Financials[Cost]). This "measure branching" is fundamental to building complex yet maintainable models.
3. The Superpower of DAX: The CALCULATE Function
If DAX had one function that defined its power, it would be CALCULATE. It is the key to unlocking sophisticated analysis.
CALCULATE changes the filter context for a calculation.
Recall that measures are evaluated within a "filter context"—the set of filters coming from your visual (e.g., a specific year on a chart axis) and slicers. CALCULATE allows you to override or add to that context.
The basic syntax is: CALCULATE(<expression>, <filter1>, <filter2>, ...)
Let's see a practical FP&A example. Imagine your general ledger data is in one large table called pnl_daily_2025, and you have a dimension table DimPL_Account that categorizes each transaction (e.g., "Revenue", "COGS", "Opex").
You can create a base measure for the total amount:PL Amount = SUM(pnl_daily_2025[Amount])
This measure isn't very useful on its own. But using CALCULATE, we can create specific P&L line items:Revenue = CALCULATE( [PL Amount], DimPL_Account[Account] = "Revenue" )COGS = CALCULATE( [PL Amount], DimPL_Account[Account] = "COGS" )
Here, CALCULATE takes our base [PL Amount] measure and applies an additional filter: calculate the sum of Amount only for rows where the account is "Revenue".
Building an FP&A Dashboard (Power BI Tutorial + Template)
Let's examine some real-world DAX measures for an FP&A dashboard. The following resource provides a fantastic set of examples for building out a full P&L.
Please read 'Step 5a. Building Profit & Loss Actual Measures'. Study the DAX code provided. Pay close attention to: How the Revenue, COGS, and Opex measures all use CALCULATE to modify the context of a single base measure, [PL Amount]. How KPIs like Gross Profit and EBITDA are then created by simply adding and subtracting these more specific measures.
4. Writing Cleaner Code with Variables
As your formulas become more complex, they can become difficult to read and debug. DAX provides the VAR...RETURN syntax to structure your calculations logically.
Using variables allows you to:
- Improve Readability: Break a complex calculation into named, logical steps.
- Boost Performance: If you need to use a calculated value multiple times within the same measure, storing it in a variable ensures it is computed only once.
- Simplify Debugging: You can temporarily change your
RETURNstatement to output the value of any intermediate variable to check your logic.
Let's look at the Headcount (EOP) measure from the resource you just read:
Headcount (EOP) =
VAR _eop = MAX('Calendar'[Date])
RETURN
    CALCULATE(
        DISTINCTCOUNT(payroll_roster_2025[EmployeeID]),
        REMOVEFILTERS('Calendar'),
        payroll_roster_2025[HireDate] <= _eop,
        OR(
            ISBLANK(payroll_roster_2025[TerminationDate]),
            payroll_roster_2025[TerminationDate] > _eop
        )
    )
Breaking it down:
VAR _eop = MAX('Calendar'[Date]): First, we create a variable_eop(end of period) that stores the latest date in the current filter context.RETURN CALCULATE(...): Then, we return the result of our main calculation.DISTINCTCOUNT(...): We count the unique employee IDs...REMOVEFILTERS('Calendar'): ...but first, we remove any existing filters on the Calendar table to ensure our date logic works correctly.payroll_roster_2025[HireDate] <= _eop: ...and apply a new filter to only include employees hired on or before the end of the period.OR(...): ...and they must either have no termination date or a termination date after the end of the period.
This is an advanced example, but it perfectly illustrates how variables make complex business logic manageable.
Test your understanding!
You have been asked to calculate the "Gross Margin %" KPI. You have already created the following two measures:
Gross Profit = [Revenue] + [COGS](Note: COGS is negative, so this is correct)Revenue = CALCULATE([PL Amount], DimPL_Account[Account] = "Revenue")
How would you write the Gross Margin % measure? Be careful about potential errors.
Show answer
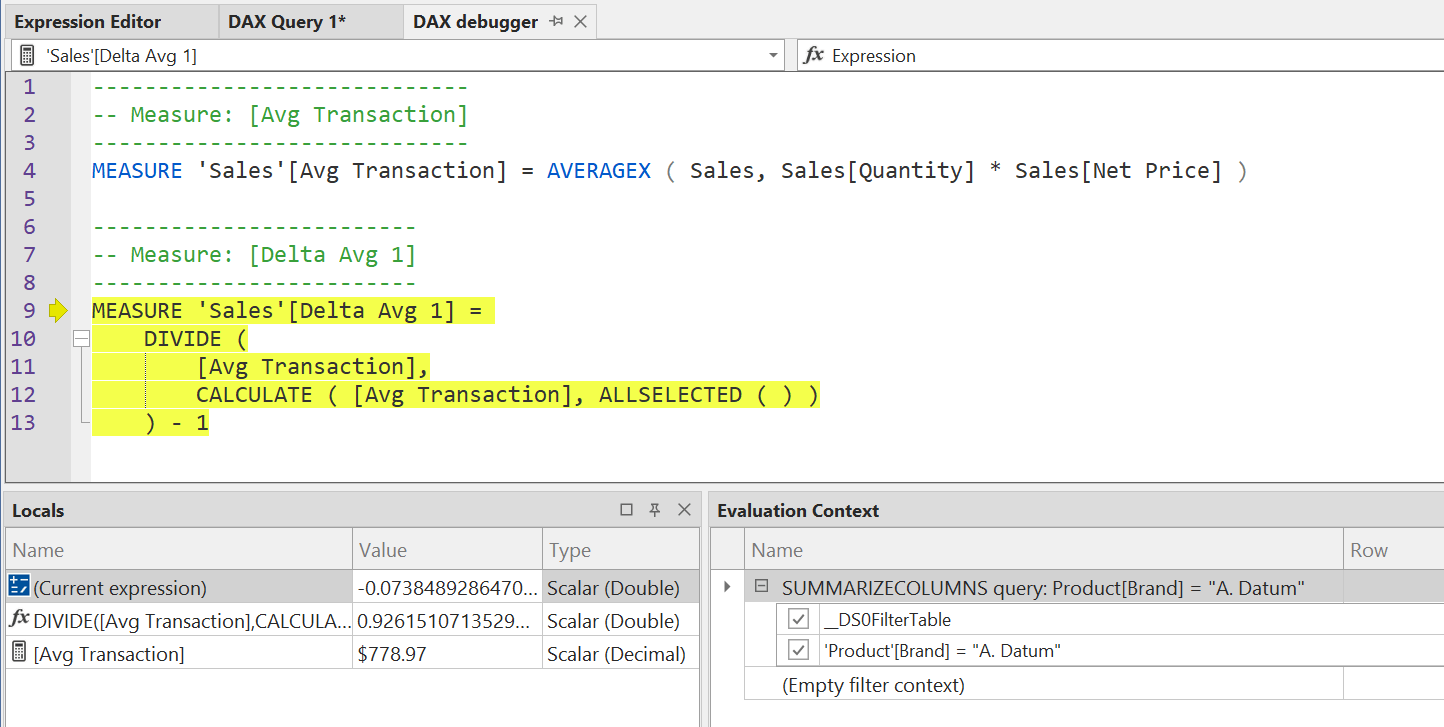
The best way to write the measure is by using the DIVIDE function, which safely handles division by zero.
Gross Margin % = DIVIDE( [Gross Profit], [Revenue] )
Using DIVIDE is preferable to [Gross Profit] / [Revenue] because if [Revenue] is zero or blank, DIVIDE will return BLANK (or an optional alternate result) instead of an error, which is much cleaner for your reports.
Conclusion
You have now taken your first and most important steps with DAX. You've learned the critical difference between measures and calculated columns, how to write basic aggregation formulas, and how to use the CALCULATE function to manipulate filter context—the core engine of DAX.
Key Takeaways:
- DAX is the formula language for Power BI; think of it as Excel formulas on steroids.
- For FP&A, use Measures for all your aggregated KPIs (Revenue, EBITDA, etc.) and use Calculated Columns sparingly for static, row-level data.
- The
CALCULATEfunction is your most powerful tool. It modifies the filter context to let you define highly specific calculations. - Use the
VAR...RETURNsyntax to write clean, efficient, and easy-to-debug measures. - Build your analysis by composing measures: create simple base measures, then reference them to build more complex KPIs.
Preview of the Next Lesson:
We have built the model's structure and learned how to write the calculations. In our next lesson, Build an interactive FP&A dashboard in Power BI, we will bring it all together. You'll use the DAX measures you've learned to create compelling visuals like waterfall charts, variance analyses, and KPI cards, transforming your data model into a powerful tool for business stakeholders.