Hello! Welcome to the first lesson in your module on Capital Budgeting and Strategic Projects.
In our last module, we focused on managing the company's existing financial health, culminating in testing debt covenants to manage risk. Now, we shift our focus from internal monitoring to evaluating future growth. As an FP&A analyst, you are a key partner in deciding where the company should invest its resources. This module will equip you with the tools to guide those critical decisions.
Today's lesson addresses the learning outcome: Structure a business case model to evaluate the financial viability of a strategic initiative. A business case is the formal proposal that justifies a significant investment, such as launching a new product, building a factory, or acquiring a competitor. Your role is to build the financial model at the heart of this proposal, providing an objective analysis to support or challenge the strategic narrative.
1. The Anatomy of a Business Case
Before opening Excel, it's crucial to understand that a financial model is just one piece of a larger strategic exercise. The model provides the quantitative backbone for a persuasive argument.
A business case is a document or presentation that makes a compelling argument for a specific course of action. It's not simply a "fill-in-the-blanks" exercise but the result of a collaborative, strategic process.
To understand this broader context, let's start with a video that explains what a business case is and the different roles involved in creating one.
Building a strong business case financial model
This clip from the video 'Building a strong business case financial model' by Danielle Stein Fairhurst explains that a business case is a highly structured strategic process, not just a spreadsheet.
Watch from 01:09 to 05:55. Pay attention to the three types of skills required—strategic analysis, modeling knowledge, and domain expertise—and how they highlight the collaborative nature of the process.
As the video explains, the financial modeler is at the heart of the process but must work with many others to gather information and understand the strategy. The model must align with the overall narrative of the business case.
This narrative typically follows a standard structure designed to lead decision-makers through a logical argument.
How to Write a Solid Business Case (with Examples and ...
The article 'How to Write a Solid Business Case' provides an excellent overview of the typical sections in a business case document.
Read the section 'How to write a business case', which lists and describes 10 key sections, from 'Executive Summary' to 'Recommendations and next steps'. You don't need to memorize them, but understand how they form a story: Problem -> Options -> Recommended Solution -> Plan & Risks. Your model will provide the numbers for sections 5, 6, 8, and 10.
Understanding this structure helps you, the modeler, anticipate what questions your model needs to answer. Your analysis will be the foundation for the Options Analysis, Recommended Solution (Costs & Benefits), and ultimately the final Recommendation.
2. Structuring the Business Case Model
Now, let's translate this strategic structure into an Excel workbook. The principles of good model design that you've learned still apply: keep inputs, calculations, and outputs separate and clearly organized.
For a business case model, a best-practice structure often involves these tabs:
- Summary/Overview: A high-level dashboard for executives showing the final results and key metrics.
- Assumptions: A central location for all the key drivers of the model (e.g., growth rates, costs, discount rate).
- Benefit Calculations: One or more tabs detailing the forecasted positive impacts (e.g., new revenue, cost savings).
- Cost Calculations: One or more tabs detailing the forecasted investments and ongoing expenses.
- Supporting Schedules: Any other detailed calculations, like depreciation or working capital, if needed.
The following image provides a perfect conceptual map for this structure.

Your ultimate goal is to produce a clear, concise summary that decision-makers can easily digest. The 'Overview' tab is where this happens. It should present the annual cash flows and the key evaluation metrics.
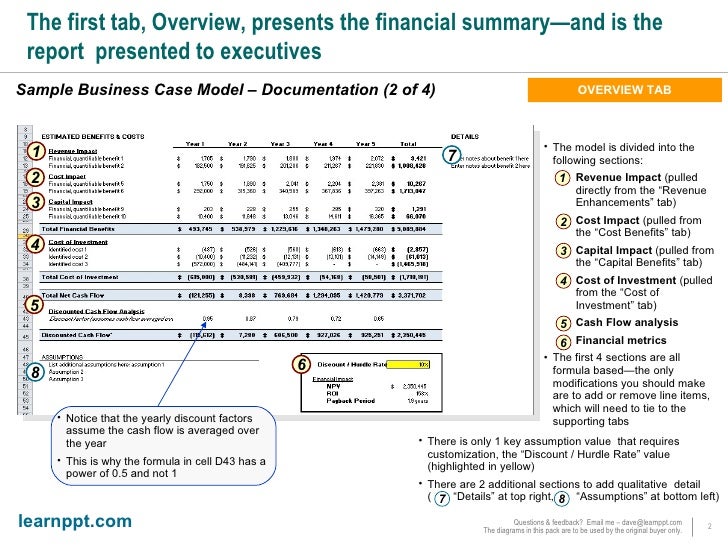
Notice how this summary directly provides the financial justification for the "Recommended Solution" section of the business case document we reviewed earlier.
3. Key Metrics for Financial Viability
With the model structure in place, how do we use it to determine if a project is financially viable? We use a set of standard investment appraisal metrics that you may have encountered in your MBA studies. The three most common are:
- Net Present Value (NPV): Calculates the present value of all future cash flows (positive and negative) from a project, discounted at a specific rate (usually the Weighted Average Cost of Capital, or WACC). A positive NPV indicates the project is expected to create value.
- Internal Rate of Return (IRR): The discount rate at which the NPV of a project's cash flows equals zero. It represents the project's expected annualized rate of return. You accept projects where the IRR is greater than the company's hurdle rate (often its WACC).
- Payback Period: The length of time it takes for a project's cumulative cash inflows to equal its initial investment. It's a simple measure of risk and liquidity, not value creation.
The following video provides a superb practical demonstration of how to calculate these metrics in Excel.
Building a strong business case financial model
Let's return to Danielle Stein Fairhurst's video. This section is a hands-on tutorial for calculating the core metrics used to evaluate a business case.
Watch the segment from 14:49 to 20:09. This is the technical core of the lesson. Focus on: The brief calculation of the WACC, which becomes the discount rate. The use of Excel's NPV and IRR functions for annual cash flows. The use of XNPV and XIRR when you have cash flows on specific dates. The logic for calculating the Payback Period manually.
One critical point to remember when forecasting benefits is the distinction between financial benefits (which impact cash flow) and notional benefits (which don't). A project that improves productivity by 20% only creates a cash benefit if it leads to a reduction in headcount or enables more revenue-generating work with the same staff. Otherwise, it's a "notional" gain that shouldn't be included in your NPV calculation.
4. Scenario and Sensitivity Analysis
A single-point forecast is guaranteed to be wrong. A robust business case must acknowledge uncertainty and test the project's viability under different conditions. This is where scenario and sensitivity analysis become essential.
Just as we stress-tested covenants in the last module, we must stress-test investment proposals. You should build your model to run at least three scenarios:
- Base Case: Your most likely estimate.
- Upside Case: An optimistic scenario.
- Downside Case: A pessimistic scenario.
The video below shows two common techniques in Excel for this.
Building a strong business case financial model
This final clip from the same video demonstrates how to incorporate scenario analysis into your model, allowing you to quickly see how changes in assumptions affect the outcome.
Watch from 20:09 to 25:15. Observe the difference between a 'manual scenario selection' (using a drop-down) and using a 'data table' for sensitivity analysis.
Presenting the range of outcomes from these scenarios gives decision-makers a much clearer picture of the risks involved and allows for a more informed decision.
Test your understanding!
Your company is evaluating two mutually exclusive projects, Project A and Project B. The company's WACC (and therefore, its discount rate) is 10%. The projected cash flows are as follows:
| Year | Project A Cash Flow | Project B Cash Flow |
|---|---|---|
| 0 | -$1,000,000 | -$1,200,000 |
| 1 | $300,000 | $400,000 |
| 2 | $400,000 | $500,000 |
| 3 | $500,000 | $600,000 |
| 4 | $600,000 | $400,000 |
- Using the
NPVfunction in Excel, calculate the NPV for each project. Remember that theNPVfunction calculates the present value of a stream of cash flows starting from Year 1, so you must add the initial investment (Year 0 cash flow) separately. The formula structure would be=NPV(rate, values_range) + initial_investment_cell. - Using the
IRRfunction, calculate the IRR for each project. - Based on your analysis, which project should the company choose and why?
Show answer
-
NPV Calculation:
- Project A NPV:
NPV(10%, C_A1:C_A4) - C_A0= $1,440,569 - $1,000,000 = $440,569 - Project B NPV:
NPV(10%, C_B1:C_B4) - C_B0= $1,514,642 - $1,200,000 = $314,642
(Note: Exact values depend on Excel calculation of PVs for each year.)
- Project A NPV:
-
IRR Calculation:
- Project A IRR:
IRR(C_A0:C_A4)= 24.9% - Project B IRR:
IRR(C_B0:C_B4)= 22.5%
- Project A IRR:
-
Recommendation:
The company should choose Project A. Both projects are acceptable as they both have positive NPVs and IRRs well above the 10% WACC. However, since they are mutually exclusive, the company must choose the one that adds more value. Project A has a higher NPV ($440k vs. $314k), meaning it is expected to generate more absolute value for shareholders. While Project B is also a good project, Project A is the superior choice for maximizing value.
Conclusion
In this lesson, you've learned how to lay the foundation for one of the most important analyses an FP&A professional performs. You've moved beyond just manipulating numbers to structuring a model that answers a critical strategic question: "Should we make this investment?"
Key Takeaways:
- A business case is a strategic argument, and the financial model is its quantitative core.
- A well-structured model separates inputs, calculations, and outputs, with a clear summary tab for executive review.
- Financial viability is primarily assessed with NPV and IRR, which measure value creation and rate of return, respectively.
- Scenario and sensitivity analysis are non-negotiable for creating a credible business case that accounts for real-world uncertainty.
Preview of the Next Lesson:
We have successfully built the skeleton of our business case model. Now, we need to add the flesh. In our next lesson, you will learn how to forecast the incremental cash flows associated with a specific project, including cannibalization and opportunity costs. This is where we dive deep into the calculation tabs, ensuring that the numbers we plug into our NPV and IRR calculations accurately reflect the project's true impact on the company.