Hello! Welcome back to the course.
In our previous lesson, we dove deep into assessing the risk of a single project using Monte Carlo simulation. This gave us a full probability distribution of potential outcomes, moving far beyond a single-point NPV estimate.
Today, we take the logical next step. A core responsibility of an FP&A analyst is not just to evaluate projects in isolation, but to help the business decide which projects to pursue from a list of competing opportunities, especially when resources like capital and people are scarce. This lesson addresses the learning outcome: Create a summary model to compare multiple investment opportunities and support capital allocation decisions.
We will cover the essential financial metrics for comparison, address common pitfalls like comparing projects of different lifespans, and finally, build a sophisticated model to select the optimal portfolio of projects that maximizes value for the company.
1. The Capital Budgeting Dashboard
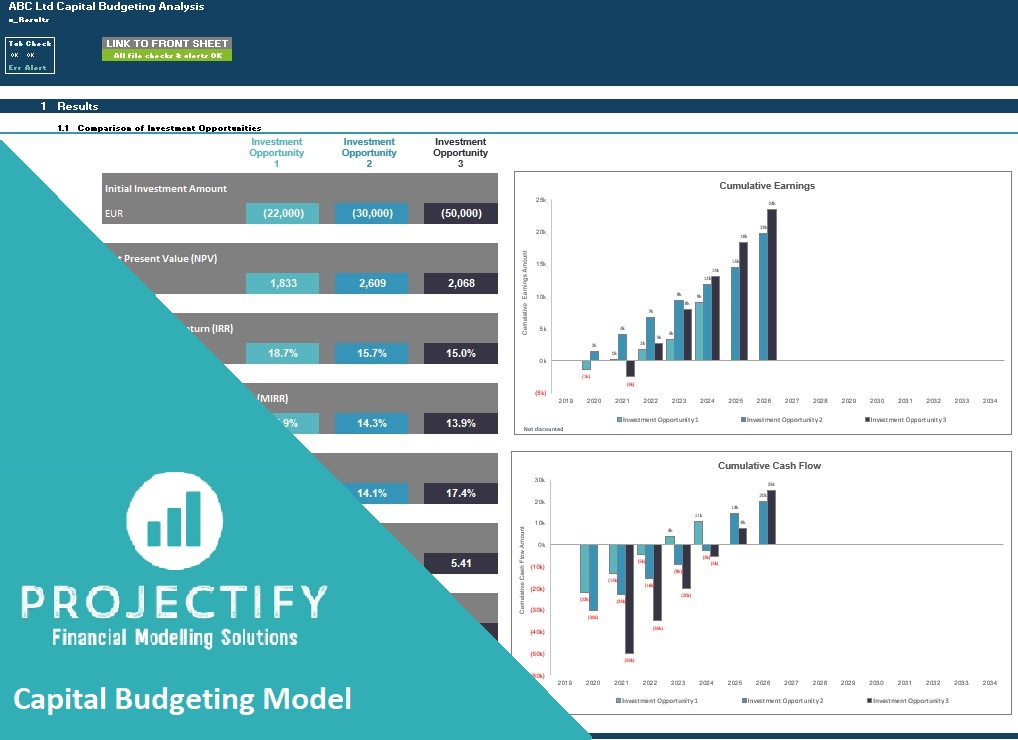
The first step in comparing projects is to consolidate the key outputs from your individual project analyses into a summary view or dashboard. For each potential project, you should have already built a financial model that calculates its cash flows and key metrics.
The most common metrics used for comparison are:
- Net Present Value (NPV): The total dollar value a project is expected to add to the company. It's the primary measure of value creation.
- Internal Rate of Return (IRR): The project's expected percentage rate of return. It must be higher than the company's hurdle rate (often the WACC) to be considered.
- Payback Period: The time it takes for a project's cash inflows to recoup the initial investment. While simple and intuitive, it ignores the time value of money and cash flows after the payback period.
- Profitability Index (PI): Calculated as
(NPV + Initial Investment) / Initial InvestmentorPV of Future Cash Flows / Initial Investment. This ratio measures the value created per dollar invested.
The PI is particularly valuable when you face capital rationing—a situation where you have more positive-NPV projects than you have capital to fund them. A project with a lower NPV but a much higher PI might be a more efficient use of limited funds.
Capital Budgeting Best Practices
To start, let's review these core investment criteria. This article from Wall Street Oasis provides a concise explanation of each metric, its calculation, and its strengths and weaknesses.
Read the section titled 'Investment Criteria Used For Capital Budgeting'. Focus on the definitions and examples for the Payback Rule, NPV, IRR, and the Profitability Index (PI). Pay close attention to the discussion of their disadvantages, as this highlights why you need a toolkit of several metrics, not just one.
A well-designed summary model presents these metrics clearly, allowing for at-a-glance comparison, often with supporting visuals.
2. Common Challenges in Project Comparison
Simply lining up the NPVs of different projects can sometimes lead to the wrong conclusion. Let's look at a common and tricky scenario: comparing mutually exclusive projects with different lifespans.
Imagine you must choose between two machines. Machine A has an NPV of $1,500 and lasts for 6 years. Machine B has an NPV of $1,000 and lasts for 3 years. Is Machine A automatically better because its NPV is higher?
Not necessarily. The comparison is misleading because at the end of year 3, you would need to replace Machine B, incurring another investment and generating further cash flows. To make a fair comparison, we need to normalize the projects to a common timeframe. The best method for this is the Equivalent Annual Annuity (EAA).
The EAA method converts a project's total NPV into its equivalent annual cash flow stream. You can then compare the annual "benefit" of each project directly.
The following video demonstrates how to calculate the EAA in Excel.
Use NPV to compare projects with different life spans
When comparing projects with different lifespans, a direct NPV comparison is flawed. This video explains why and introduces a superior method called Equivalent Annual Annuity (EAA).
Watch the following segments: 00:00 - 01:03: Understand the core problem of comparing two projects with unequal lives. 03:23 - 04:46: Learn how to calculate the EAA using Excel's PMT function. This is the key practical technique.
The EAA is calculated in Excel using the PMT function: =PMT(rate, nper, pv).
rate: The project's discount rate (WACC).nper: The project's lifespan in years.pv: The project's NPV.
By calculating the EAA for both projects, you can determine which one provides a greater annual value, giving you a more robust basis for your decision.
Test your understanding!
A company is choosing between two mutually exclusive projects. The discount rate is 10%.
- Project X: Costs $100,000, has a 5-year life, and an NPV of $41,461.
- Project Y: Costs $150,000, has an 8-year life, and an NPV of $53,349.
Based only on NPV, Project Y looks better. Which project is superior when evaluated using the EAA method?
Show answer
To find the EAA, we use the PMT function in Excel.
- EAA for Project X:
=PMT(10%, 5, 41461)= $10,936 - EAA for Project Y:
=PMT(10%, 8, 53349)= $10,000
Even though Project Y has a higher total NPV, Project X provides a greater equivalent annual value. Therefore, using the EAA method, Project X is the better choice.
3. Incorporating Qualitative and Strategic Factors
Financial metrics are essential, but they don't tell the whole story. A project might have a slightly lower NPV but be strategically crucial for entering a new market, blocking a competitor, or developing a new technology platform. A great FP&A analyst facilitates a decision-making process that balances financial returns with strategic goals.
A Project Prioritization Scorecard is an excellent tool for this. It provides a structured framework to score projects on both quantitative and qualitative dimensions.
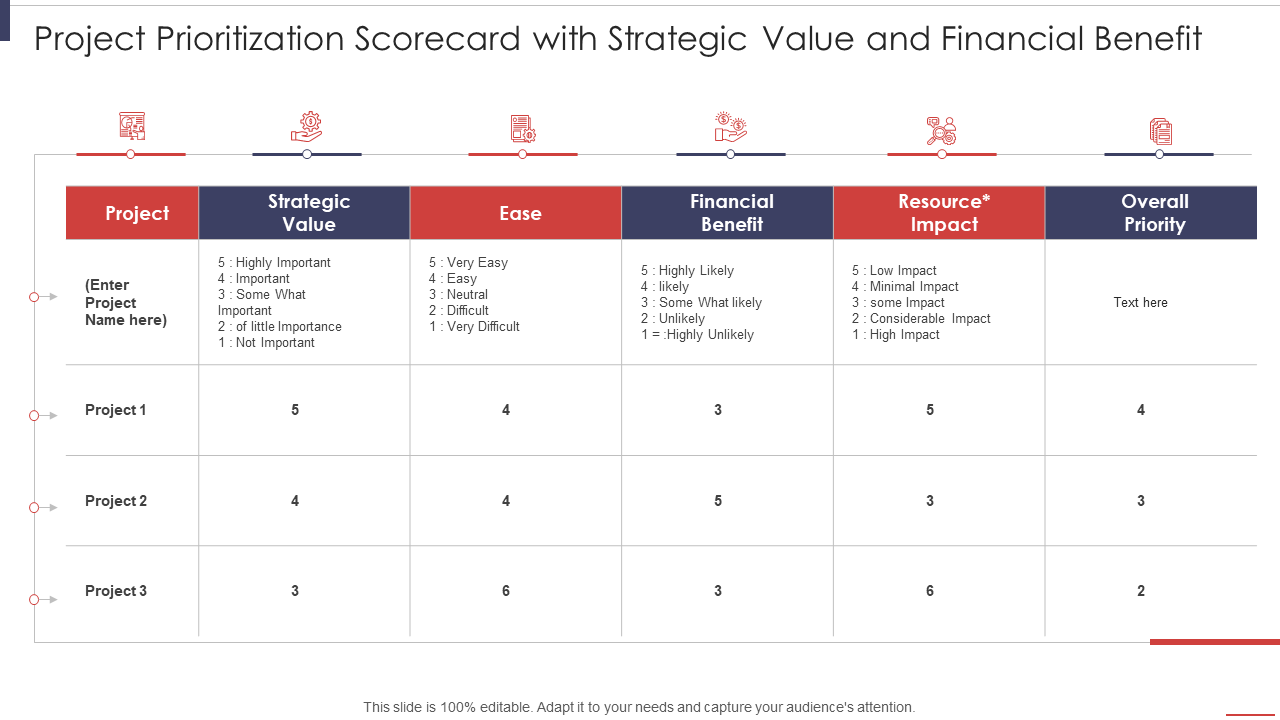
Using a model like this allows you to:
- Promote Objectivity: It forces stakeholders to define and agree upon the criteria for what makes a "good" project.
- Facilitate Discussion: It creates a common language for managers from different functions (e.g., engineering, marketing, finance) to debate the merits of various proposals.
- Ensure Strategic Alignment: It explicitly links project selection to the company's long-term strategy.
4. Optimal Capital Allocation Under Constraints
Now for the final and most powerful step. Imagine you are an FP&A analyst at a large company. You have a dozen promising projects proposed by different divisions, a total capital budget of $50 million, and a limited number of software engineers available.
How do you select the combination of projects that creates the maximum possible value without exceeding your budget or resource constraints? Simply ranking by PI might not work if projects have very different sizes and resource needs.
This is a classic optimization problem that can be solved elegantly using the Solver Add-in in Excel. Solver allows you to find the optimal value for a target cell (in our case, maximizing total NPV) by changing other cells (selecting which projects to fund), subject to a set of constraints (budget, labor, etc.).
Your experience in civil engineering has likely exposed you to optimization problems in structural design or logistics. The principle here is identical: finding the best solution within a set of fixed boundaries.
Using Solver for capital budgeting
When you have many interdependent projects and a limited budget, we can use Excel's Solver to find the combination of projects that maximizes total NPV. This guide from Microsoft provides a clear, step-by-step tutorial.
Read through this guide to understand the setup. Focus on: The Core Problem: The scenario of maximizing NPV with limited capital and labor. The Model Setup: Understand how to define the target cell (Total NPV using the SUMPRODUCT function), the binary changing cells (a column of 0s and 1s representing 'No' or 'Yes' for each project), and the constraints (total resource usage <= resource availability). The Solver Dialog: See how to configure the Solver add-in, paying special attention to adding the 'Bin' (binary) constraint to the changing cells. Handling Dependencies: Note how to add constraints for project interdependencies, such as 'If we do Project 3, we must also do Project 4.' This is a powerful feature for modeling real-world business rules.
Mastering this technique is a significant differentiator. It moves you from simply reporting on individual projects to providing a holistic, optimized recommendation for the company's entire investment portfolio. This is the kind of high-impact analysis that is highly valued in top-tier FP&A roles.
Conclusion
In this lesson, you have assembled a complete toolkit for comparing investment opportunities and supporting capital allocation decisions. You've gone from evaluating a single project to strategically selecting an entire portfolio of them.
Key Takeaways:
- A summary model comparing projects should include key financial metrics like NPV, IRR, Payback, and Profitability Index (PI).
- For comparing mutually exclusive projects with unequal lifespans, the Equivalent Annual Annuity (EAA) method provides a more accurate comparison than NPV alone.
- Effective decision-making balances financial metrics with qualitative factors. A Project Prioritization Scorecard is a practical tool for ensuring strategic alignment.
- When faced with multiple projects and resource constraints, you can use Excel Solver to find the optimal portfolio of projects that maximizes total NPV.
Preview of the Next Lesson:
We have now completed our deep dive into capital budgeting and strategic project analysis. The next phase of your FP&A journey is to understand how these analyses and their resulting decisions are managed, monitored, and communicated across the business. In our next lesson, we will begin Module 11, "FP&A Processes and Executive Reporting," starting with how to design a standard monthly financial close and reporting calendar for an FP&A team. This is the operational backbone that ensures financial information flows smoothly and enables effective management.