Hello! Welcome to your next lesson.
In our last session, we focused on the crucial task of forecasting a project's incremental cash flows—the raw material for any sound investment decision. We learned to distinguish accounting income from true cash flow and to identify often-hidden costs like cannibalization and opportunity costs.
Today, we will use the cash flow stream you now know how to build to answer the ultimate question: "Should we do this project?" We will achieve this by mastering two of the most fundamental tools in finance.
This lesson is dedicated to the learning outcome: Calculate and interpret Net Present Value (NPV) and Internal Rate of Return (IRR) to assess project profitability. This is a cornerstone concept in corporate finance and a non-negotiable skill for any FP&A analyst. We'll cover the theory, the practical Excel calculations, and, most importantly, the critical thinking required when these two powerful metrics give conflicting advice.
1. Net Present Value (NPV): The Gold Standard
The single most important principle in finance is that a dollar today is worth more than a dollar tomorrow. Net Present Value (NPV) is the application of this principle. It calculates the total value a project will add to the company in today's dollars.
Using NPV and IRR in Project Investment Decisions
To build a rigorous understanding of NPV, let's start with a clear, in-depth explanation. This resource explains why NPV is considered the most reliable metric for project evaluation.
Please read the section 'Understanding Net Present Value (NPV) in Depth.' Focus on: The Time Value of Money Foundation: Why we must discount future cash flows. The NPV Formula: Understand the components: CF_t, r, and t. Interpreting NPV Results: The simple but powerful decision rules.
As you've just read, the logic is straightforward:
- We forecast all future incremental cash flows from a project.
- We discount them back to their present value using a discount rate (often the company's Weighted Average Cost of Capital, or WACC), which represents our opportunity cost of capital.
- We subtract the initial investment.
The formula is:
Where:
- = Cash flow in period
- = Discount rate
- = Time period
- = Initial investment (at time t=0)
The decision rule is simple and powerful:
- If NPV > 0: The project is expected to generate more value than it costs. Accept.
- If NPV < 0: The project is expected to destroy value. Reject.
- If NPV = 0: The project's return is exactly equal to the discount rate. You are indifferent.
Calculating NPV in Excel
Now, let's move from theory to practice. This video provides a clear, step-by-step guide to calculating NPV in Excel and highlights a very common mistake that analysts make.
How to Calculate NPV, IRR & ROI in Excel || Net Present Value || Internal Rate of Return
This video from Matt Macarty will walk you through calculating NPV in Excel. It starts with a manual calculation to build intuition and then introduces the built-in function.
Watch the video from the beginning until the 5:57 mark. Pay close attention to the section from 04:14 to 05:57, which explains the correct way to use Excel's =NPV() function, ensuring you don't accidentally discount the initial investment.
The key takeaway from the video is critical: Excel’s =NPV() function assumes the first cash flow in your selected range occurs one period from today. Therefore, the correct formula structure in Excel is:
=NPV(rate, range_of_cash_flows_from_Year1_onwards) + initial_investment_at_Year0
(Note: The Year 0 cash flow is usually a negative number, so you are effectively subtracting it).
2. Internal Rate of Return (IRR): The Intuitive Metric
While NPV gives you an absolute dollar value, executives often prefer to think in terms of percentage returns. This is where the Internal Rate of Return (IRR) comes in.
IRR is the discount rate that makes the NPV of a project equal to zero.
Conceptually, it is the project's annualized rate of return. You can think of it as the "break-even" discount rate.
The decision rule for IRR is to compare it to your "hurdle rate," which is the minimum acceptable rate of return for a project (typically the WACC).
- If IRR > Hurdle Rate: The project's expected return exceeds your minimum requirement. Accept.
- If IRR < Hurdle Rate: The project fails to meet your minimum required return. Reject.
The following image provides a fantastic visual for the relationship between NPV and IRR. The NPV Profile plots the project's NPV at various discount rates. The IRR is the point where the line crosses the x-axis (where NPV = 0).

Calculating IRR in Excel
Let's return to the video to see how to calculate IRR.
How to Calculate NPV, IRR & ROI in Excel || Net Present Value || Internal Rate of Return
We'll continue with the same video from Matt Macarty.
Now, watch the section from 5:57 to 8:00. This part demonstrates the =IRR() function and interprets the result in the context of the project's cost of capital.
Unlike the NPV function, the =IRR() function in Excel is more straightforward. You simply include the entire range of cash flows, including the initial investment at Year 0.
=IRR(range_of_all_cash_flows_from_Year0_onwards, [guess])
For greater precision when cash flows don't occur at perfect yearly intervals, you can use the XNPV and XIRR functions, which allow you to specify exact dates for each cash flow.
Test your understanding!
A project has the following incremental cash flows. The company's hurdle rate is 10%.
| Year | Cash Flow |
|---|---|
| 0 | -$100,000 |
| 1 | $30,000 |
| 2 | $40,000 |
| 3 | $50,000 |
| 4 | $45,000 |
- Calculate the project's NPV.
- Calculate the project's IRR.
- Based on these metrics, should the company accept or reject the project?
Show answer
- NPV: Using the formula
=NPV(10%, B3:B6) + B2(assuming cash flows are in cells B2:B6), the NPV is $32,389. - IRR: Using the formula
=IRR(B2:B6), the IRR is 25.2%. - Decision: Accept. The project should be accepted because its NPV is positive ($32,389 > 0) and its IRR is greater than the hurdle rate (25.2% > 10%).
3. NPV vs. IRR: When Metrics Collide
For a single, standalone project, NPV and IRR will almost always lead you to the same accept/reject decision. However, a major part of an FP&A analyst's job is to help choose between competing projects. When you have two or more mutually exclusive projects (meaning you can only choose one), NPV and IRR can give you conflicting rankings.
This is a classic problem in finance, and knowing how to handle it is essential.
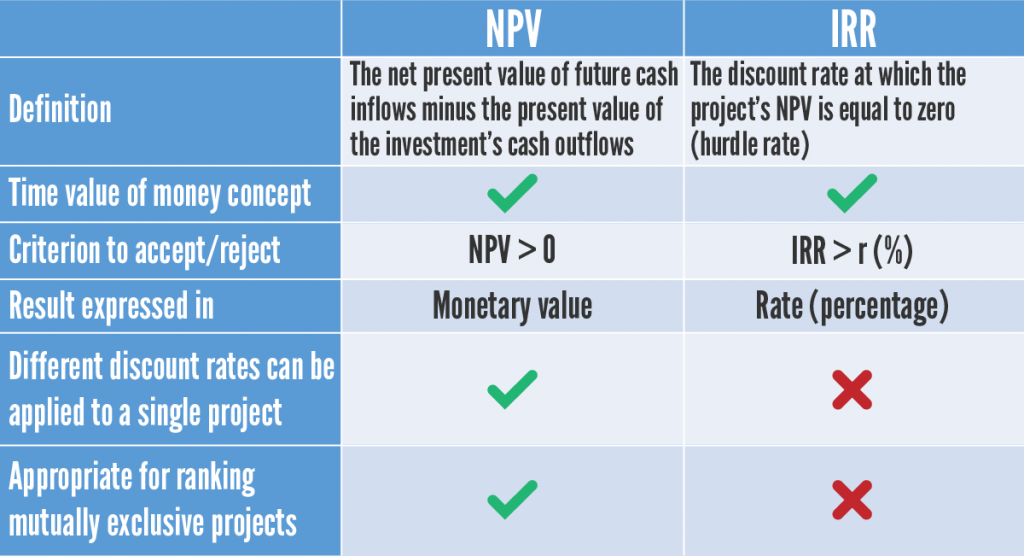
To see exactly how these conflicts arise, let's watch a short, clear video explanation.
This video from 365 Financial Analyst clearly explains why NPV and IRR can give conflicting rankings for mutually exclusive projects and which one you should ultimately trust.
Please watch the entire video (about 7.5 minutes). It covers: When the two rules can disagree (mutually exclusive projects). An example showing a conflict due to project scale (different investment sizes). An example showing a conflict due to cash flow timing. The underlying reason for the conflict: the reinvestment rate assumption.
The Verdict: Trust NPV
As the video and finance theory conclude, when there is a conflict between NPV and IRR, you should always base your decision on NPV.
Let's use a reading to solidify why.
Using NPV and IRR in Project Investment Decisions
Let's revisit the text resource from PLProjects to get a detailed breakdown of the conflict and the theoretical justification for NPV's superiority.
Please read the section 'NPV vs IRR – Key Differences and When They Conflict.' Focus on the section 'Why NPV Should Generally Prevail.'
To summarize the key reasons for preferring NPV:
- Measures Absolute Value: NPV tells you the exact dollar amount of value a project adds to the firm. IRR gives a percentage, which can be misleading. A 50% return on a $10 investment is less valuable than a 20% return on a $1,000,000 investment.
- Realistic Reinvestment Assumption: NPV implicitly assumes that the project's intermediate cash flows are reinvested at the discount rate (the company's cost of capital), which is a reasonable assumption. IRR assumes these cash flows are reinvested at the IRR itself, which can be unrealistically high.
IRR is still a valuable communication tool because of its intuitive, percentage-based format, but NPV should drive the final decision.
Conclusion
Today, we've moved from forecasting cash flows to making a definitive investment decision. You've learned the mechanics and interpretation of both NPV and IRR, which are the primary tools for capital budgeting. Most importantly, you now understand the nuances of how to apply them, especially in situations with competing projects where a superficial analysis could lead to the wrong choice.
Key Takeaways:
- NPV measures the absolute increase in firm value in today's dollars. The decision rule is to accept projects with an NPV greater than zero.
- IRR measures a project's expected percentage rate of return. The decision rule is to accept projects where the IRR exceeds the required hurdle rate.
- For mutually exclusive projects, NPV and IRR can conflict due to differences in scale or cash flow timing.
- In case of conflict, NPV is the superior criterion because it directly aligns with the goal of maximizing shareholder wealth and has a more realistic reinvestment rate assumption.
Preview of the Next Lesson:
Our analysis so far has relied on a single set of cash flow forecasts. But what if those forecasts are wrong? A key part of building a robust business case is understanding how sensitive the project's profitability is to changes in key assumptions. In our next lesson, we will learn how to "Build a dynamic pricing model that incorporates price elasticity assumptions to simulate revenue and profit impacts," which is a powerful way to perform this kind of sensitivity analysis.