Introduction
In our last lesson, we delved into the architecture of large-scale metrics and logging systems, using Google's Monarch as a case study. We saw how to collect vast amounts of telemetry data while managing the twin crises of cardinality and cost. However, collecting data is only half the battle. The true value lies in using that data to answer a critical question: is our service reliable enough for our users?
This lesson builds directly on that foundation, addressing the learning outcome: Define SLOs, SLIs, and error budgets and explain their role in data-driven reliability management. We will move from the raw material of metrics to the structured, actionable framework that underpins modern Site Reliability Engineering. For a prospective Principal Engineer, mastering this framework is non-negotiable. It's the common language used to negotiate trade-offs between feature development and stability, transforming reliability from an emotional debate into a data-driven engineering discipline.
The Language of Reliability: SLI, SLO, SLA, and Error Budgets
Before we dive deep, let's establish a clear mental map of the core concepts. These terms are often used interchangeably, but they represent distinct ideas with a clear hierarchy.
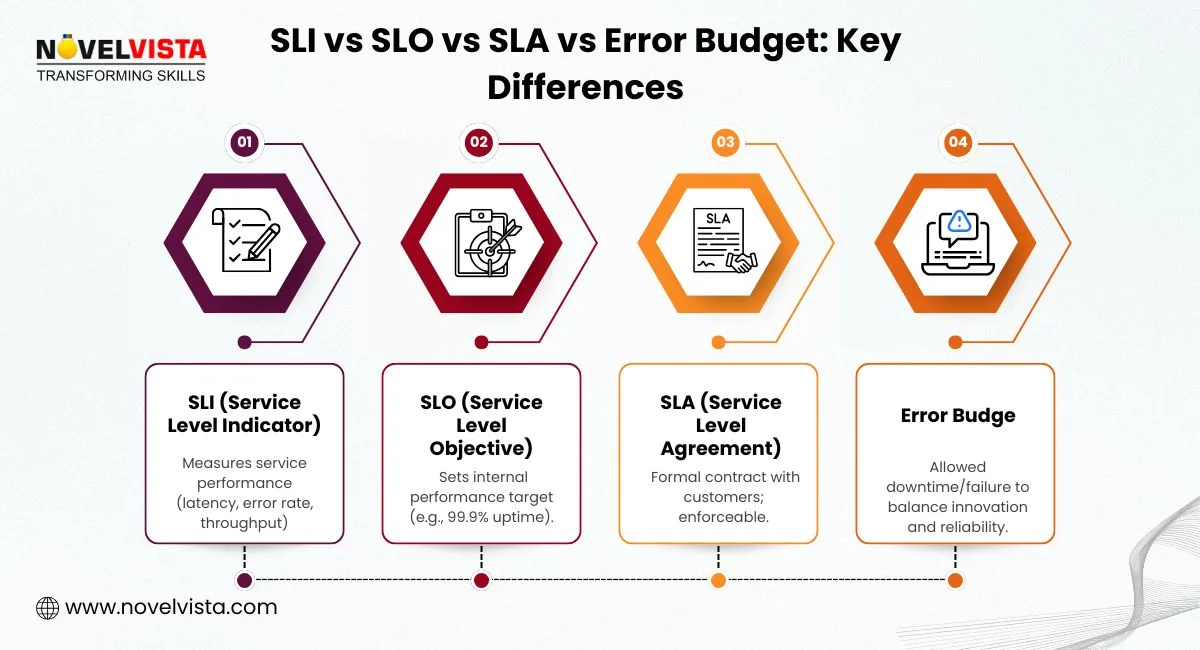
Our primary focus as engineers is on SLIs, SLOs, and Error Budgets. SLAs are typically the domain of business and legal teams, and they represent an external promise that should be much looser than your internal engineering objectives (SLOs).
Service Level Indicator (SLI): The Measurement
An SLI is a direct, quantifiable measure of some aspect of the service you provide. The SRE discipline has a strong opinion on what constitutes a good SLI. It should be a ratio of two numbers: the number of "good" events divided by the total number of valid events.
Chapter 2 - Implementing SLOs - Google SRE
The Google SRE workbook provides the canonical definition of these concepts. This section explains what an SLI is and how to formulate one.
In the chapter "Implementing SLOs," read the subsection titled "What to Measure". Pay close attention to the structure of an SLI as a ratio and the examples provided. Then, read the part that distinguishes between an SLI specification and an SLI implementation.
This ratio format, good events / total valid events, is powerful because it yields a percentage from 0% to 100%, which is intuitive and universally understood.
There are four common categories of SLIs that cover most user-facing systems.
Service Level Objectives (SLOs) - noob to pro in under 30 minutes!
This video provides a very clear and concise breakdown of the four basic types of SLIs.
Watch the segment from the four basic categories to understand how latency, availability, consistency, and throughput measure different facets of a service's reliability from the user's perspective.
For example, for a typical backend API, you might define:
- Availability SLI: The proportion of successful HTTP requests (e.g., status codes
2xx,3xx,4xxexcluding429) out of all valid requests.5xxresponses would count as "bad" events. - Latency SLI: The proportion of successful requests that complete in under a certain threshold (e.g., 500ms) out of all successful requests.
Service Level Objective (SLO): The Target
An SLO is the target value you set for an SLI, measured over a specific time window. For example:
- Availability SLO: 99.9% of requests will be successful over a rolling 28-day window.
- Latency SLO: 99% of successful requests will be served in under 500ms over a rolling 28-day window.
A core tenet of SRE is that 100% is the wrong target. Striving for perfect reliability is prohibitively expensive and prevents any change or innovation, as change is the number one source of outages. The goal of an SLO is to define a reliability level that is good enough to keep the vast majority of your users happy.
Error Budget: The Currency of Risk
Once you have an SLO, the Error Budget is a direct consequence.
If your availability SLO is 99.9%, your error budget is 0.1%. This isn't just a number; it's a quantifiable budget of "unreliability" that you are allowed to spend over the time window. If you receive 100 million requests in 28 days, a 0.1% error budget means you can have up to 100,000 failed requests without breaching your objective.
This budget is the central mechanism for data-driven decision making. It transforms conversations from "Can we launch this risky feature?" to "Do we have enough error budget to afford the potential impact of this launch?"
The 'Why': A Principled Framework for Decisions
At the Principal Engineer level, understanding the definitions is table stakes. The critical skill is understanding how this framework fundamentally changes how engineering teams operate and make decisions.
Chapter 2 - Implementing SLOs - Google SRE
This reading explains the fundamental motivation behind SLOs and how they are used to make concrete engineering decisions.
Please read two sections from the SRE workbook: Why SREs Need SLOs, which frames SLOs as a tool for prioritization. The introduction to the section Decision Making Using SLOs and Error Budgets, which shows how the budget can be used to compare the impact of different reliability projects.
The error budget provides a shared incentive for development and operations teams.
- If the service is running well and has plenty of error budget remaining, the team has a "green light" to take risks: ship new features, perform risky migrations, or run experiments. Innovation velocity increases.
- If the service is consuming its error budget too quickly or has exhausted it, the team has a clear, data-backed mandate to stop feature development and focus exclusively on reliability improvements. This might mean freezing new releases, rolling back a problematic change, or prioritizing bugs that are causing errors.
This data-driven approach removes emotion and politics from prioritization, creating a virtuous cycle where developers are incentivized to build reliable features to "protect" the error budget they need for future launches.
Let's listen to Steve McGhee, a Google SRE, describe how this framework was implemented at Google and became the common language for discussing reliability.
How to get started with SLI/SLO with Steve McGhee
This video offers a practitioner's view from inside Google on how SLOs are used to drive culture and decisions.
Please watch two key segments: A common language: McGhee explains how SLOs became a lingua franca between service teams at Google, allowing them to understand each other's reliability without needing deep domain knowledge. What do we do with it?: This segment explains the concept of error budget burn rate—how quickly you are spending your budget—and why it's more important than the budget level itself.
As McGhee highlights, you don't wait for the budget to be zero. You monitor the burn rate.

Alerting on a high burn rate allows teams to react proactively before the SLO is breached, which is the cornerstone of an effective SLO-based alerting strategy.
A Practical Guide to Implementing SLOs
Defining good SLOs is a strategic process that requires collaboration between product managers, developers, and SREs. The Google SRE workbook outlines a clear, iterative process.
Chapter 2 - Implementing SLOs - Google SRE
This reading provides a step-by-step guide to defining and getting agreement on SLOs.
Please read the following three sections: Start at "A Worked Example". Focus on the methodology: identifying user interactions, abstracting components into types (request-driven, pipeline, storage), and selecting appropriate SLIs for each. Read the short section "Getting Stakeholder Agreement". This highlights the social and organizational aspect of implementing SLOs. Finally, read "Establishing an Error Budget Policy". This emphasizes the need for a written policy that dictates the consequences of exhausting the error budget.
Let's summarize the key steps in this process:
- Identify Critical User Journeys (CUJs): What are the most important things users do with your service? Placing an order, loading a profile page, performing a search. Reliability should be measured against what users actually care about.
- Select SLI Specifications: For each CUJ, choose the right indicators. Is latency the most critical factor? Availability? Data freshness? Use the component types (request-driven, pipeline, etc.) as a guide.
- Choose SLI Implementations: How will you measure the SLI? From server logs? Load balancer metrics? Client-side instrumentation? Each has trade-offs in accuracy and cost, as we discussed in the last lesson. Start with what's easiest to measure and iterate.
- Set SLO Targets: Analyze historical performance to set an initial, achievable target. If your API has historically been 99.95% available, setting a 99.9% SLO is a reasonable starting point.
- Gain Stakeholder Agreement: This is a crucial leadership task. Product owners must agree the SLO reflects user happiness. Developers must agree to the error budget policy. SREs must agree the SLO is defensible. Without this shared agreement, an SLO is just a number on a dashboard with no power to drive decisions.
- Document and Iterate: Write down the SLOs, the rationale behind them, and the error budget policy. Review them regularly. Are they too loose? Too tight? Do they accurately predict user (un)happiness?
Conclusion
This lesson moved us from raw observability data to a sophisticated framework for managing reliability as an engineering and business discipline. By defining SLIs, SLOs, and error budgets, we create a data-driven system for making objective trade-offs.
Here are the key takeaways:
- SLIs measure reliability, SLOs set the target. An SLI is a ratio of good events to total events, while an SLO is the percentage target for that SLI over a time window.
- The Error Budget is the engine of data-driven reliability. It is the 100% - SLO allowance for failure, and it serves as the currency for balancing feature velocity against stability.
- User happiness is the ultimate goal. SLOs are not about arbitrary technical metrics; they are an attempt to create a proxy for user satisfaction. The entire process begins by identifying critical user journeys.
- SLOs are a socio-technical system. They require technical implementation for measurement, but their power comes from stakeholder agreement on an error budget policy that dictates real-world consequences for reliability performance.
In our next lesson, we will put this framework into action. We'll explore how to move beyond simple threshold-based alerting to a more intelligent system based on error budget burn rates, addressing the learning outcome: Design an effective alerting strategy based on SLOs and error budgets to minimize alert fatigue.