Introduction
In our last lesson, we built a robust alerting strategy based on SLOs and error budgets. That system is designed to tell us what is broken and when to intervene. Now, an alert has fired, the on-call engineer has been paged, and the clock is ticking. The immediate question shifts from "what" to "why." This lesson directly addresses the learning outcome: Explain techniques for systematic root cause analysis in multi-service architectures.
We will move beyond ad-hoc debugging and into the realm of formal, scalable troubleshooting methodologies—a critical competency for a Principal Engineer. This involves not only understanding a structured process for diagnosis but also appreciating the nature of the data required to effectively navigate the complex, often non-deterministic world of distributed systems. We will explore the framework Google SRE uses for troubleshooting and then examine the modern observability principles that make this process fast and effective.
The Core Challenge: Why is Root Cause Analysis So Hard?
Before diving into solutions, it's crucial to appreciate why finding the root cause of a failure in a distributed system is fundamentally more difficult than in a monolith. The core issue is the intrusion of an unpredictable, "messy" physical reality—networks, disks, schedulers—into our logic. This introduces non-determinism, making failures transient, difficult to reproduce, and often emergent from a rare confluence of events.
The following talk from the Strange Loop conference provides an excellent, visceral explanation of this challenge.
"Testing Distributed Systems w/ Deterministic Simulation" by Will Wilson
This talk, "Testing Distributed Systems w/ Deterministic Simulation," brilliantly articulates the fundamental problems of non-repeatability and correlated failures that make debugging these systems so painful.
Please watch two key segments: The introduction explains how non-idempotent operations, packet reordering, and transient network conditions create bugs that are nearly impossible to reproduce on demand. The discussion on the Hurst exponent introduces a powerful concept: hardware failures are not independent random events. This explains why multiple, cascading failures are more common than naive models predict and are precisely the scenarios we must be prepared to diagnose.
The key insight is that our systems are subject to rare, correlated failures that are difficult to reproduce. A methodology for Root Cause Analysis (RCA) cannot assume a simple, repeatable bug. It must be a process of systematic investigation, akin to a detective arriving at a complex crime scene.
A Systematic Framework for Troubleshooting
Given the inherent complexity, relying on intuition or ad-hoc debugging is not a scalable strategy. Effective organizations adopt a formal, repeatable methodology. Google's incident response process provides a high-level map for how to approach an issue.
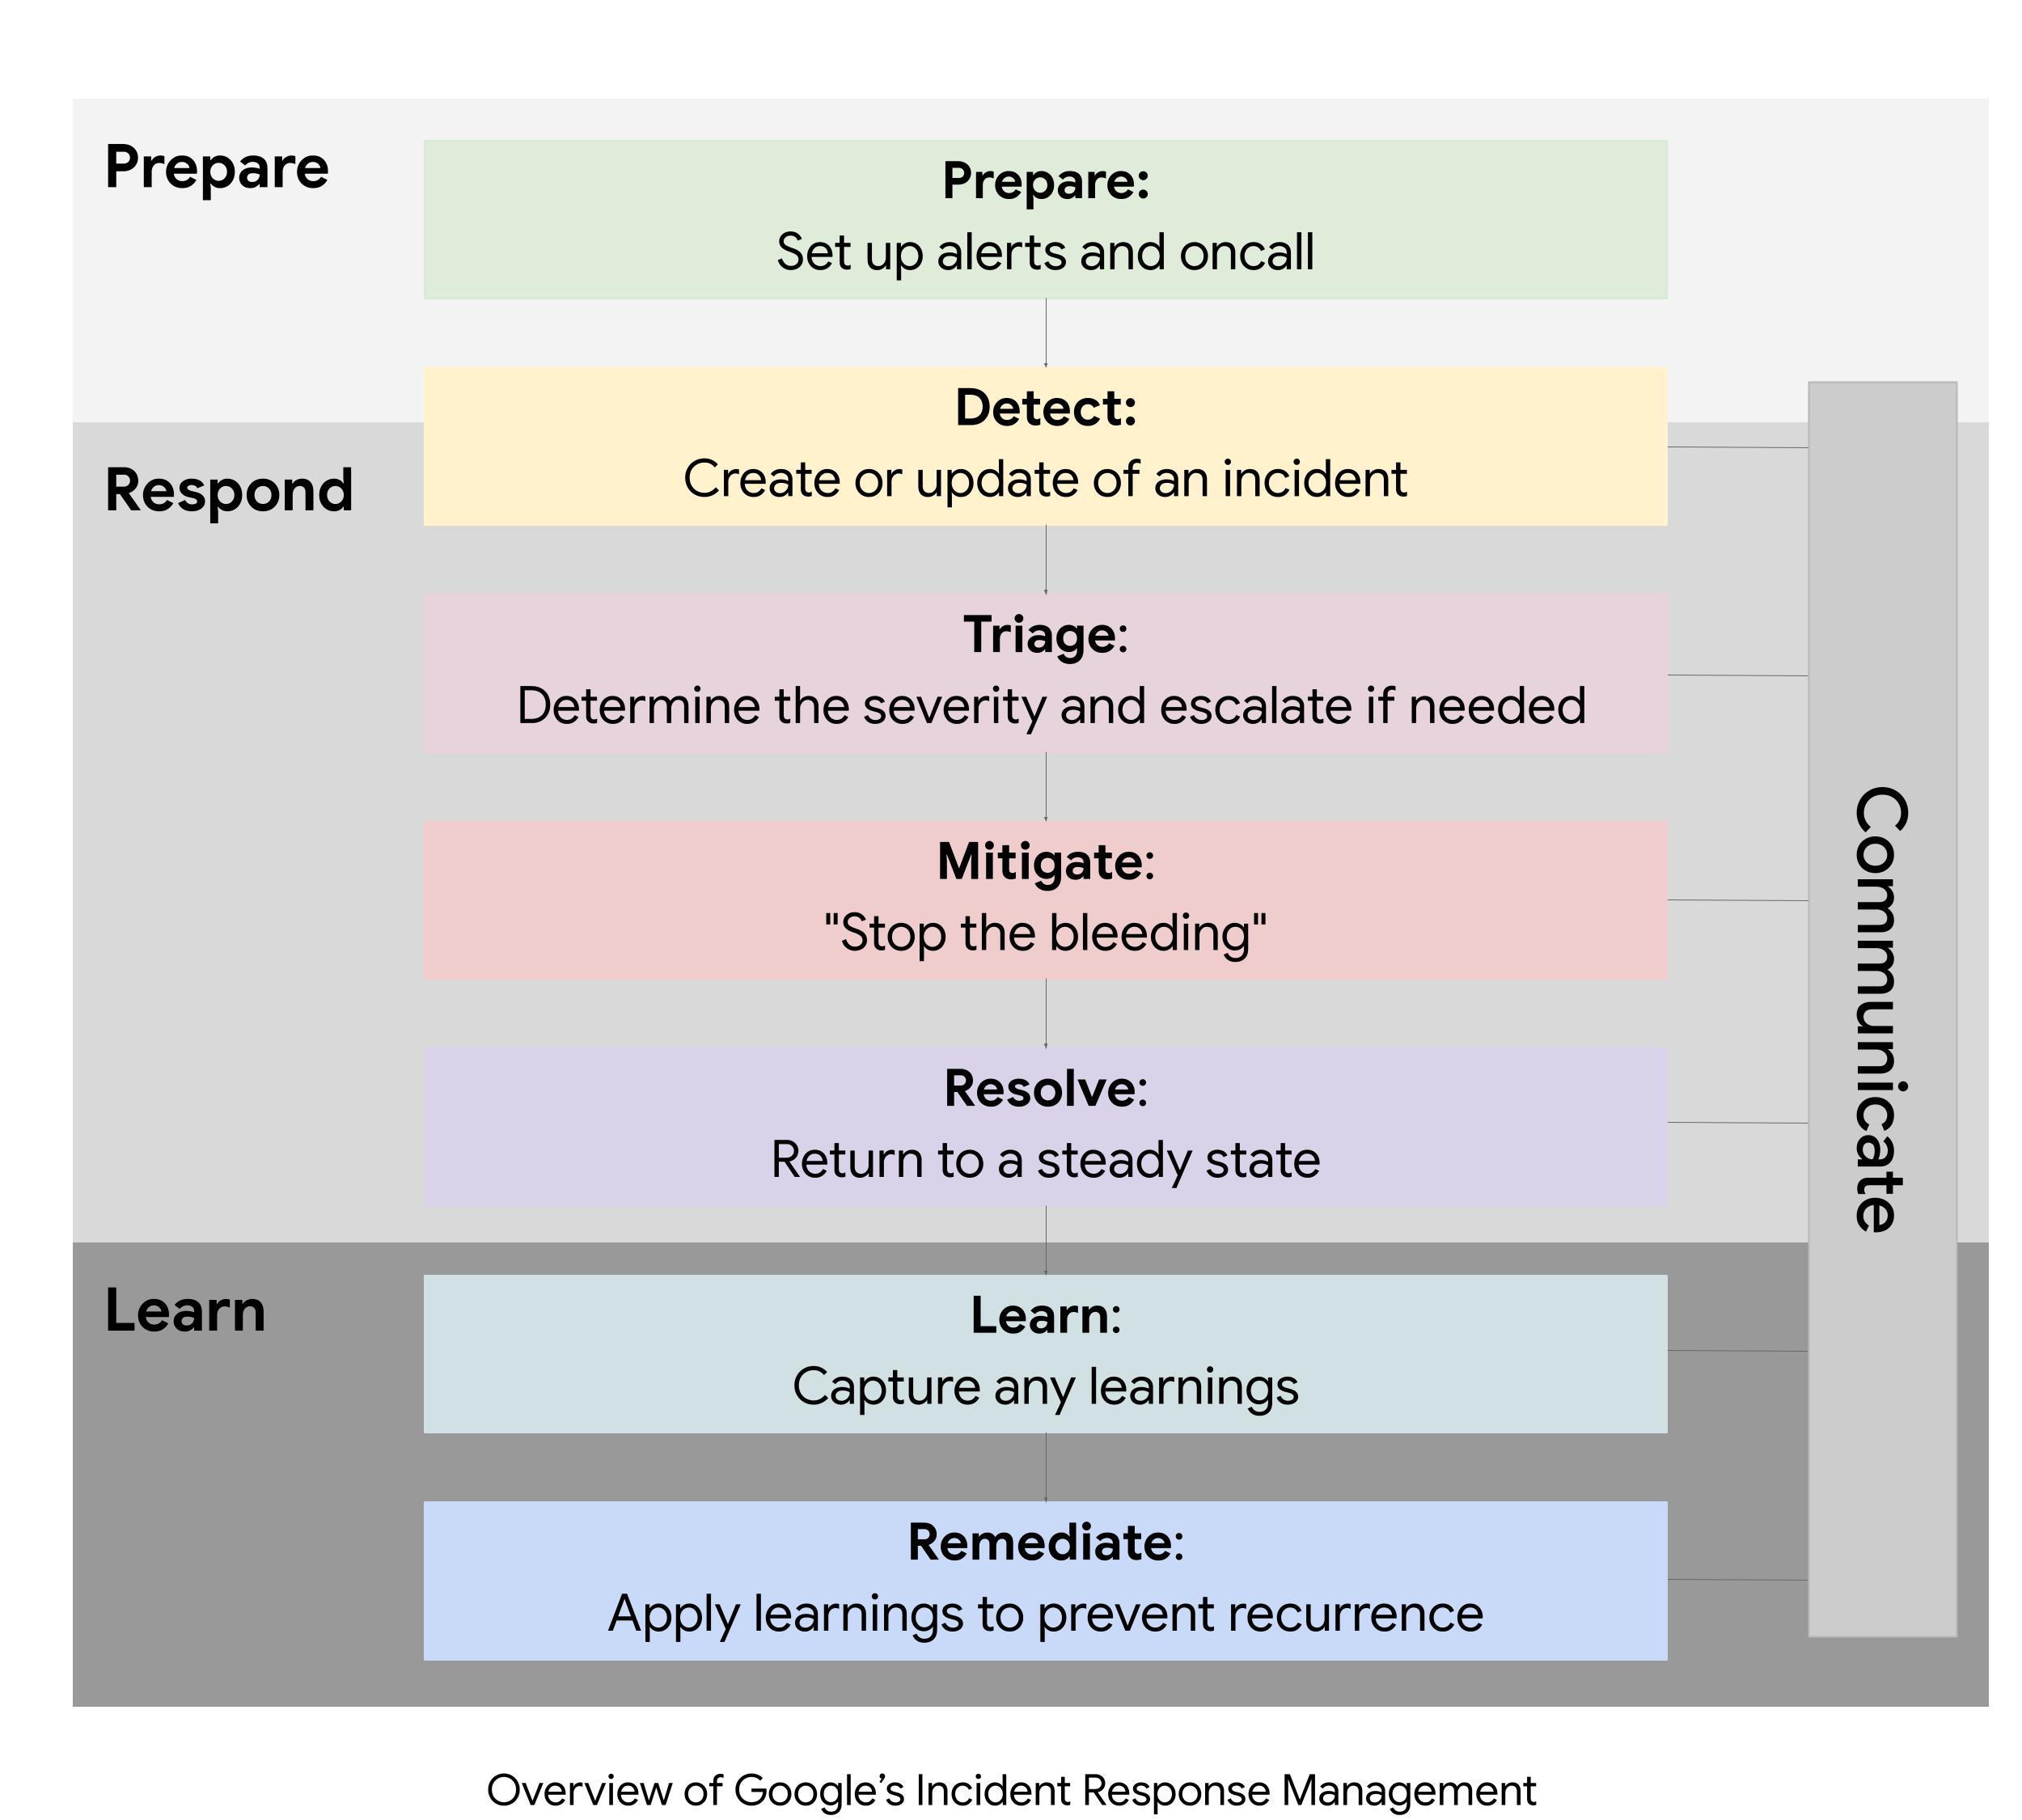
The Google SRE book provides a detailed, battle-tested process that expands on this "Respond" phase. It formalizes troubleshooting as an application of the hypothetico-deductive method: iteratively forming and testing hypotheses based on evidence.
Troubleshooting Methodology: A Learning Path
This chapter from the Google SRE book lays out a generic, systematic process for troubleshooting any complex system.
Please read the following sections to understand this methodology: Start with the introduction to the theory, which frames troubleshooting as a scientific method. Also review the Common Pitfalls subsection, which highlights common logical fallacies. Next, read the section on Triage. This reinforces the most critical first step: stabilize the system ("stop the bleeding") before diving deep into root-causing. Finally, read the sections on Examine and Diagnose. These form the core of the investigation, covering data gathering and hypothesis formulation. Pay special attention to the "What touched it last" principle.
Let's summarize the key stages of this practical methodology:
-
Triage: Your first priority is to mitigate user impact. This might mean rolling back a change, diverting traffic, or disabling a non-critical feature. A Principal Engineer's first instinct during an outage should be towards stabilization, not immediate diagnosis. Preserve evidence, but fly the plane first.
-
Examine: This is the data-gathering phase. You immerse yourself in the system's telemetry—metrics, logs, and traces—to understand its state and behavior leading up to and during the failure. The quality and accessibility of this data are paramount.
-
Diagnose: With data in hand, you begin to form hypotheses. The SRE book suggests powerful starting points:
- What changed? A vast majority of incidents are triggered by a change: a code deployment, a configuration push, a shift in user traffic patterns, or even a dependency's change. Correlating the start of the incident with recent events is the most effective single heuristic in RCA.
- Divide and Conquer: Systematically trace the problem through the stack or use bisection to narrow down the faulty component.
- Ask "what, where, why": What is the system trying to do? Where is it spending its resources (CPU, memory, I/O)? Why is it behaving that way?
-
Test and Treat: You design and run experiments to prove or disprove your hypotheses. This could be as simple as querying a specific backend or as complex as injecting specific test traffic.
-
Cure: Once the root cause is confirmed, you implement a permanent fix and, crucially, document the entire process in a postmortem to ensure the learnings are captured and disseminated.
The Fuel for RCA: High-Cardinality Observability
The SRE book's methodology is sound, but its effectiveness is entirely dependent on the quality of data available in the "Examine" phase. In a modern multi-service architecture, this is where many teams struggle.
The traditional "three pillars" model of observability—metrics, logs, and traces—often leads to data silos. You might see a spike in a metric dashboard, then have to manually copy a request ID and paste it into a separate logging tool, and then again into a tracing tool. The cognitive load of correlating these separate views is immense and slows down RCA.
Charity Majors, a prominent voice in the observability space, argues that the next generation of observability is defined by unified, high-cardinality data. This perspective is highly aligned with the internal tooling philosophy at Google.
Observability: the present and future, with Charity Majors
In this interview, Charity Majors discusses her experience at Facebook using their internal tool, Scuba, and explains why high-cardinality data is a game-changer for debugging complex systems.
Please watch these two key segments: The Parse/Facebook story is a powerful real-world example. Listen for how the ability to slice and dice data by high-cardinality dimensions (like app_id or user_id) reduced the time to find a root cause from hours to seconds. The explanation of cardinality is essential. It clarifies what "cardinality" means, why traditional time-series (metrics) databases struggle with it, and why it is the "most valuable data" for debugging.
The core idea is that to understand unique problems, you need to be able to ask questions about unique identifiers—user_id, request_id, customer_tenant_id, build_id, etc. This is high-cardinality data. Effective RCA in a microservices world depends on the ability to:
- Collect wide, structured events that contain rich context (not just a metric value or a log string).
- Group, filter, and slice this data by any field, no matter how many unique values it has.
- Seamlessly transition between views—from a high-level graph (metric), to the specific requests causing the problem (trace), to the detailed payload of a single event (log)—without losing context.
This is the promise of multi-modal RCA, an area of active academic and industry research. It treats metrics, traces, and logs not as separate pillars but as different visualizations of a single, unified source of truth about system events.
A Landscape of RCA Techniques
With a systematic process and high-quality data, we can apply various analytical techniques. As a Principal Engineer, you should be familiar with the landscape of these approaches, understanding their strengths and weaknesses. Recent academic surveys, such as the one from arXiv (LINK), categorize them well.
-
Statistical & Correlation-Based Methods:
- What it is: These are often the simplest techniques. They involve looking for statistical correlations between anomalous metrics, or between log event patterns and a failure.
- Example: "The latency of service C spiked at the same time as the CPU usage of its database. Let's investigate the database."
- Limitation: This is a good starting point but is famously prone to the "correlation is not causation" fallacy. A single root cause can create a storm of correlated but downstream symptoms.
-
Graph-Based Methods:
- What it is: This is the heart of most modern, automated RCA systems. The system's architecture (service dependencies) and request flows (traces) are represented as a graph. Algorithms then traverse this graph to find the likely epicenter of a failure.
- Example: A
PageRank-style or random-walk algorithm is run on the service dependency graph. Nodes (services) that are "blamed" by many downstream, failing nodes will receive a higher "root cause" score. This automatically filters out the downstream noise from the likely source. - Strength: This approach is well-suited to the propagative nature of faults in distributed systems and can quickly narrow the search space from hundreds of services to a handful of candidates.
-
Machine Learning & AI-Based Methods:
- What it is: This is an evolving but powerful category. Models can be trained to recognize patterns associated with known failures, classify new types of anomalies, or perform causal inference on multi-modal data.
- Example: A Graph Neural Network (GNN) can learn the complex, non-linear relationships between metrics, logs, and traces across the entire system to pinpoint a root cause with higher accuracy than simpler graph algorithms.
- Future: As Charity Majors mentioned, LLM-based agents are emerging that can interactively query observability systems, form hypotheses, and guide an engineer through the RCA process.
In a real incident, you will likely use a combination of these. You might start with a high-level correlation, use a graph-based tool to narrow down the candidates, and then perform deep analysis on the logs and traces of the suspect service to confirm your hypothesis.
Conclusion
In this lesson, we have constructed a comprehensive framework for systematic root cause analysis. This is a core discipline of reliability engineering and a critical skill for technical leadership.
Key takeaways include:
- Systematic Process is Key: Ad-hoc debugging doesn't scale. Follow a formal methodology like the one used by Google SRE: Triage, Examine, Diagnose, Test, and Cure.
- First, Stop the Bleeding: The primary responsibility during an incident is to mitigate impact, not to immediately find the root cause.
- Data Quality Dictates Speed: The velocity of your RCA is limited by the quality of your observability data. Modern RCA thrives on unified, high-cardinality data that allows for rapid slicing and dicing without dead ends.
- Think in Graphs: Failures in distributed systems propagate through a graph of dependencies. The most powerful RCA techniques leverage this structure to distinguish root causes from downstream symptoms.
- Know the Landscape: A Principal Engineer should be aware of the different classes of RCA techniques, from simple correlation to sophisticated graph and ML-based analysis.
You are now equipped with a methodology for moving from "what" is broken to "why." In our next lesson, we will put this knowledge into practice. We will tackle the learning outcome: Analyze a distributed system outage scenario using traces, logs, and metrics to construct a timeline of events. This will be a practical exercise in applying the diagnostic mindset we've developed today.