Introduction
Welcome to the next step in our exploration of observability. In previous lessons, we've established a powerful mental model: distributed tracing helps us pinpoint where a problem lies in a complex request path, and profiling techniques like those used in Google-Wide Profiling help us understand why a specific service is performing poorly. Today, we confront the foundational architectural challenge that underpins all of this: how do we design the systems that collect, store, and serve this observability data at planetary scale, without bankrupting the organization?
This lesson directly addresses the learning outcome: Design a metrics and logging strategy for a large-scale distributed system, considering cardinality and cost. As a prospective Principal Engineer, this isn't just a technical exercise; it's a strategic one. You are expected to design systems that provide deep visibility while operating within strict resource and cost constraints. We'll use Google's Monarch system as a deep-dive case study, dissecting the design choices that allow it to operate at Google's scale. We will also examine modern, industry-wide debates on the best way to structure this data, contrasting traditional metrics with structured logs.
The Twin Crises: Cardinality and Cost
At the heart of any metrics strategy lies a fundamental tension. We want to attach as much context as possible to our measurements. For example, knowing the total number of errors is useful, but knowing the number of errors per customer, per service version, and per datacenter is far more powerful for debugging. Each piece of unique context we add (a customer ID, a version hash, a location) is a new dimension, and the total number of unique combinations of these dimensions is the cardinality.
As cardinality explodes, so does the number of unique time series you must store, index, and query. This leads directly to an explosion in cost—for memory, storage, CPU, and network. This problem is so central that it shapes the entire architecture of modern monitoring systems.
To get a sense of the current industry thinking on this challenge, the following talk by Charity Majors, a prominent voice in the observability space, frames the problem as a generational shift.
Is It Time To Version Observability? (Signs Point To Yes) • Charity Majors • GOTO 2024
This GOTO conference talk, "Is It Time To Version Observability?", introduces the concepts of Observability 1.0 (metrics-first) and 2.0 (structured logs-first), arguing that the cost and limitations of high-cardinality metrics are forcing a change in strategy.
Please watch the following segments: The introduction to the core idea of Observability 1.0 vs 2.0, contrasting the "three pillars" model with a "single source of truth." The nature of metrics, where she explains their strengths for summarization and their critical weakness with high cardinality. The cost model, which provides a concrete, if dramatic, example of how cardinality directly drives up costs in metrics-based systems.
Majors argues that the traditional approach—pre-aggregating data into low-cardinality metrics—discards the very context needed for deep debugging. The alternative she proposes is to treat wide, structured log events as the source of truth. This is a powerful idea, but it comes with its own set of engineering challenges. How do you build a system that can handle this firehose of raw data? Google's answer is Monarch.
Case Study: Google's Monarch
Monarch is Google's planet-scale, in-memory time series database, built to replace its predecessor, Borgmon. The Monarch paper is a masterclass in designing for scale, and it directly addresses the cardinality and cost problems we've discussed.
First, let's understand Monarch's data model. It isn't just a key-value store for metrics; it's a schematized, relational model.
[PDF] Monarch: Google's Planet-Scale In-Memory Time Series Database
This paper is the definitive guide to Google's internal monitoring system. We'll read the sections that lay out the problem space and the core data model.
Please read the following sections: Section 1, Introduction, to understand the scale of the problem Monarch was built to solve and the limitations of its predecessor. Section 3, Data Model. Pay close attention to the distinction between Targets (the entity being monitored) and Metrics (the measurement). Note the different value types, especially distribution.
The key insight here is schematization. A time series in Monarch is not an arbitrary string; it is a point in a well-defined table formed by joining a target schema and a metric schema.

This structured approach allows Monarch to validate, optimize, and efficiently route queries. But how does it handle the raw volume and cardinality? The answer lies in its collection architecture.
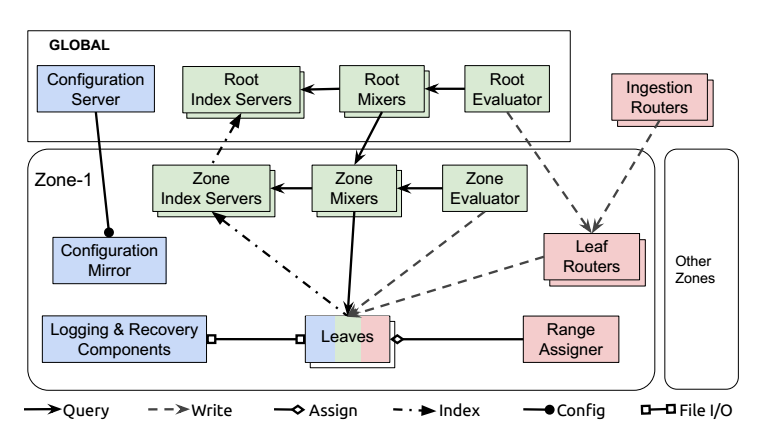
Taming Cardinality with Collection Aggregation
Monarch's most powerful weapon against cardinality is collection aggregation. For extremely high-cardinality data sources, it's simply not feasible to store a unique time series for every possible combination of labels. The paper gives the example of disk I/O, where you might want to track usage per user across millions of disk servers. This would generate tens of billions of time series.
Instead of storing this raw data, Monarch aggregates it during ingestion.
[PDF] Monarch: Google's Planet-Scale In-Memory Time Series Database
This section details Monarch's most important strategy for managing cost and scale.
Please read Section 4.3, Collection Aggregation. Focus on understanding how it uses delta time series, bucketing, and a sliding admission window to aggregate data on the fly.
This technique is a critical design pattern. Instead of every disk server writing a cumulative value for "IOPs for user X," it writes a delta: "IOPs for user X in the last 10 seconds." Routers and leaves can then efficiently sum these deltas into a single, lower-cardinality time series (e.g., sum(IOPs) by user), drastically reducing the storage and query cost. As the paper notes, this is not just a theoretical optimization; on average, Monarch aggregates 36 input time series into one, and in extreme cases, over a million to one.
The video below gives a great walkthrough of the architecture and lessons learned, including the importance of this pre-aggregation.
Monarch, Google’s Planet-Scale Streaming Monitoring Infrastructure | Google
This talk by a Google staff engineer provides an accessible overview of Monarch's architecture and the practical lessons learned from scaling it.
Please watch these two key segments: The ingestion process, which describes how pre-aggregation fits into the data flow. The high-cardinality problem, where the speaker explicitly calls out the need to reduce dimensions for large users and gives the disk I/O example.
Designing a Holistic Strategy
Monarch provides a powerful blueprint for a metrics-focused system. However, as a Principal Engineer, you need to design a comprehensive strategy for both metrics and logs. We can synthesize the lessons from Monarch with the broader industry trends and practical cost management techniques.
A robust strategy can be broken down into a few key design pillars. The Google Cloud blog post, "Cloud Logging cost management best practices," though focused on a specific product, provides an excellent general-purpose framework.
Cloud Logging cost management best practices
This article outlines a pragmatic, four-step approach to managing logging costs, which we can adapt into a general strategy.
Read through the four steps described in the article: Analyze, Eliminate, Optimize, and Alert. Pay attention to the specific techniques mentioned, like exclusion filters and sampling.
Let's integrate these ideas into a design framework.
1. Define What to Collect (and What Not To)
- Metrics: Use a Monarch-style system for your core operational health signals (the "golden signals": latency, traffic, errors, saturation). These are typically high-volume but have predictable, relatively low cardinality.
- Action: Define strict schemas for your core metrics.
- Action: Aggressively use collection aggregation for any metric where cardinality threatens to explode (e.g., per-user statistics, per-request-ID metrics).
- Structured Logs: Reserve detailed, high-cardinality logging for two primary use cases:
- Critical business events: An
order_placedevent that containsuser_id,cart_id,item_skus,total_value, etc. - Debug/Trace events: One wide event per service per request, containing all relevant local context, as advocated by Charity Majors. This is invaluable for debugging unknown-unknowns.
- Critical business events: An
- Action: Implement exclusion rules to drop noisy, low-value logs at the source (e.g., verbose health checks, successful 2xx load balancer logs). Consider sampling for logs where volume is high but individual events are less critical.
2. Configure the Lifecycle: Retention and Downsampling
Not all data has the same value over time.
- Hot Tier: High-resolution metrics and logs needed for real-time alerting and debugging might only need to be retained for a few hours or days.
- Warm/Cold Tier: You can downsample older data to save costs. For example, metrics might go from 10-second resolution to 1-minute resolution after 24 hours, and 10-minute resolution after 30 days. Logs can be moved from fast, expensive storage to cheaper, slower object storage (like Google Cloud Storage or Amazon S3) for long-term compliance or historical analysis.
- Action: Define tiered retention policies for different classes of data. Monarch's configuration system allows users to do this explicitly.
3. Instrument for Correlation
A metric spike is a signal; a log line is context. The real power comes from linking them.
- Action: Ensure that your application logs include identifiers that can correlate them to metrics. For instance, if a metric has a
serviceandversionlabel, your logs should contain the same information. - Action: Propagate trace and span IDs through your entire stack—RPCs, logs, and even as exemplars in your metrics. Monarch's ability to attach a Dapper trace ID as an exemplar to a high-latency distribution is a prime example of this. When you see a latency spike, you can immediately jump to the exact trace that caused it.
4. Monitor the Monitors
Finally, your observability platform is itself a critical distributed system.
- Action: Apply the same principles to monitoring your monitoring system. Track ingestion volume, query latency, and cardinality of your metrics.
- Action: Set up billing and usage alerts to catch runaway costs before they become a major problem. A bug that accidentally adds a high-cardinality label like a timestamp to a metric can cause costs to skyrocket.
Conclusion
Designing a metrics and logging strategy for a large-scale system is a constant balancing act between visibility, cost, and performance. There is no single "right" answer, only a series of well-reasoned trade-offs.
Here are our key takeaways:
- Cardinality is the core challenge: The number of unique time series you generate directly dictates the cost and complexity of your monitoring system.
- Monarch's playbook is powerful: Techniques like schematization to structure data, and especially collection aggregation to reduce cardinality during ingestion, are essential patterns for building scalable metrics platforms.
- Structured logs are the future of debugging: While metrics are excellent for summarizing known system behaviors, high-cardinality structured logs are unparalleled for exploring unknown issues and preserving critical context.
- A hybrid strategy is pragmatic: A successful design will likely use a metrics-first approach for well-understood operational signals and a structured-logging-first approach for deep debugging and business analytics, with strong correlation between them.
- Strategy is an active process: You must continuously analyze usage, optimize collection and retention policies, and monitor costs to keep the system effective and efficient.
In our next lesson, we will build directly upon this foundation. Now that we have a strategy for collecting high-quality observability data, we will ask: what do we do with it? We will explore how to translate raw data into formal guarantees of service health by addressing the learning outcome: Define SLOs, SLIs, and error budgets and explain their role in data-driven reliability management.