Introduction
In our last lesson, we constructed a professional, post-engagement survey by combining the validated Couples Satisfaction Index (CSI) with custom questions tailored to your unique consulting services. Having a robust instrument for data collection is the first step. Now, we must turn that raw data into strategic intelligence. This lesson is dedicated to the analytical process, directly addressing the learning outcome: Analyze survey data to identify patterns in client satisfaction and areas for service improvement.
We will move beyond simple averages and explore how to uncover the deep structure within your client feedback. You will learn to identify not just what clients are satisfied or dissatisfied with, but which factors have the most significant impact on their overall experience. This allows you to prioritize your efforts and invest resources where they will yield the greatest improvements in client outcomes and practice reputation. To do this, we will introduce a powerful framework known as Key Driver Analysis.
From Raw Scores to Visual Insights
Once you begin collecting survey responses, your first step will be to summarize the data. For the custom questions you designed using Likert scales (e.g., "Strongly Disagree" to "Strongly Agree"), calculating a mean score is useful, but it can hide important details in the distribution of responses. A more insightful method is to visualize the full spread of responses.
A diverging stacked bar chart is an excellent tool for this. It centers the neutral category ("Neither Agree nor Disagree") at the zero point and plots positive and negative responses as bars diverging in opposite directions. This makes it immediately obvious which aspects of your service are polarizing and which garner broad consensus.

Looking at this chart, you can quickly see the "shape" of the feedback. For instance, the top bar shows strong agreement, while the third bar ("Was the training material and content helpful to you?") reveals a significant portion of disagreement. This type of visualization turns a table of numbers into a clear narrative about client sentiment.
Beyond Description: Introducing Key Driver Analysis
Visualizing descriptive statistics tells you how clients rated individual aspects of your service. To build a truly self-improving practice, you need to know why. Which of these aspects are most critical to a client's overall satisfaction? Answering this question is the purpose of Key Driver Analysis (KDA).
KDA is a statistical technique used to determine the relative impact of several predictor variables (the "drivers") on an outcome variable. In your context:
- Outcome Variable: The client's overall satisfaction. This could be their score on a dedicated question like, "Overall, how satisfied were you with the engagement?" or their total score on the CSI-16.
- Drivers (Predictor Variables): The client's ratings on your custom questions about specific service features (e.g., quality of communication tools, effectiveness of emotional integration exercises, clarity of the engagement plan).
The goal of KDA is to assign an "importance" weight to each driver, revealing which elements of your service are the most powerful levers for improving overall client satisfaction.
This resource from SurveyMonkey provides a solid introduction to the concept and its business applications.
Using Key Driver Analysis With Your Survey Data | SurveyMonkey
This article explains the fundamental purpose of KDA and the necessary data structure to perform it.
Please read the introduction, What is key driver analysis?, to solidify your understanding of its function. Then, read the section on when to use it, focusing on the definitions of the outcome variable and the drivers (predictors). Note the emphasis on using discrete numeric variables, which you've already implemented with your Likert scales.
The Statistical Engine of KDA
Given your background in statistics, you'll appreciate that several methods can be used to determine the "importance" of each driver. The most common approach involves correlation and regression, but it comes with a significant caveat.
A more advanced video from the Market Research Institute International provides an excellent overview of the descriptive, diagnostic, and predictive uses of KDA.
Advanced Analytics - Key Drivers Modeling
This video frames KDA as a core analytical tool for moving beyond simple data inspection.
Watch the following segments: The introduction explains the core goal: measuring the strength of the relationship between an outcome (satisfaction) and its predictors (service features). "Why do we need key drivers?" outlines its uses for description, diagnosis (prioritizing improvements), and prediction (modeling "what-if" scenarios). The public transport example demonstrates how the analysis produces a hierarchy of importance. Pay attention around the mention of intercorrelation between attributes and the use of Shapley value regression to account for it. This is a crucial point.
As the video highlighted, a major challenge with survey data is that your drivers are often correlated (multicollinearity). For example, a client's satisfaction with "communication tools" might be related to their satisfaction with "logistical management." Standard multiple linear regression can produce unreliable estimates of importance in these situations.
A superior method, specifically designed for this context, is Relative Importance Analysis, which is related to the Shapley regression mentioned in the video. This method correctly apportions the influence of correlated predictors by evaluating their marginal contribution across all possible combinations. It provides a more accurate and stable measure of each driver's unique importance.
This article from Displayr explains the distinction clearly.
Identifying Drivers of Customer Satisfaction - Displayr
This resource makes a direct comparison between standard linear regression and relative importance analysis, arguing for the latter's superiority with survey data.
Focus on the section Relative importance analysis, which explains why it is more reliable than linear regression for correlated data. Also, review the section on the Correlation matrix, which serves as a good diagnostic tool to check for multicollinearity among your drivers.
From Numbers to Strategy: The Importance-Performance Matrix
The ultimate output of your KDA should be a clear, actionable guide for service improvement. The Importance-Performance Matrix (also called an Importance-Performance Map Analysis or IPMA) is the perfect tool for this.
This 2x2 grid plots each of your service drivers based on two dimensions:
- X-axis: Importance (The relative weight calculated from your KDA).
- Y-axis: Performance (The average satisfaction score for that driver from your survey data).
This visualization immediately sorts your service attributes into four strategic quadrants.
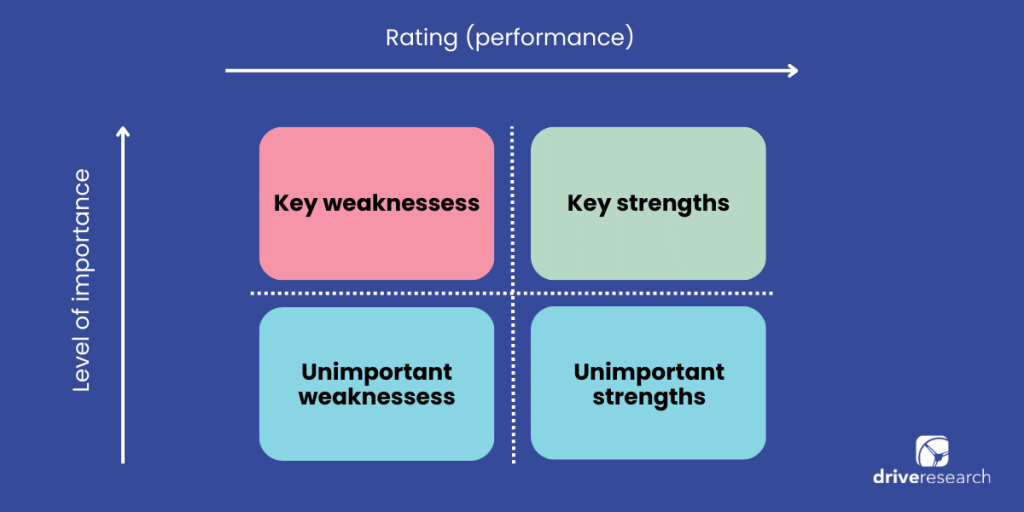
Here is how to interpret the quadrants:
- Key Strengths (High Importance, High Performance): These are the things your clients value most and that you are delivering effectively. Your strategy here is to maintain and leverage these strengths. They are the core of your value proposition.
- Key Weaknesses (High Importance, Low Performance): This is the most critical quadrant. These are attributes that significantly drive client satisfaction but are currently underperforming. Your strategy is to concentrate your improvement efforts here. Gains in this area will have the largest positive impact on overall satisfaction.
- Unimportant Weaknesses (Low Importance, Low Performance): You aren't performing well on these, but clients don't care very much. The strategy is to deprioritize these. Do not waste resources fixing things that don't drive value.
- Unimportant Strengths (Low Importance, High Performance): You are excelling at things that don't matter much to clients. This could indicate "over-delivery." The strategy is to reduce investment and reallocate those resources to your "Key Weaknesses."
This video provides a very clear, practical walkthrough of creating and interpreting an Importance-Performance Map.
SmartPLS 4: Importance Performance Map Analysis
This is a software demonstration, but the principles of interpretation are universal and highly valuable.
Watch the brief introduction to understand the goal of the analysis. The most important section is the interpretation of the map, from explaining the visual. Pay close attention to how the X-axis represents importance (total effect) and the Y-axis represents performance. Finally, see how these insights are translated into a decision-making framework from this concluding segment, which discusses where to apply resources for maximum impact.
Action Plan: Implementing Your Analysis Loop
To put this into practice, you can follow a systematic process as part of your regular business review (e.g., quarterly):
- Aggregate Data: Collate the responses from the post-engagement surveys of all clients within the period.
- Calculate Performance: For each custom survey question (your drivers), calculate the average score. This is your "Performance" metric for the Y-axis.
- Calculate Importance:
- Define your outcome variable (e.g., the "Overall Satisfaction" question).
- Run a Relative Importance Analysis with your drivers as predictors of the outcome variable. The resulting weights are your "Importance" metric for the X-axis.
- Plot the Matrix: Create the 2x2 Importance-Performance chart, positioning each driver in the appropriate quadrant.
- Formulate Strategy:
- Identify the drivers in the "Key Weaknesses" quadrant.
- Brainstorm and document specific, actionable steps to improve performance on these critical items. For example, if "Tools for logistical management" is a key weakness, an action item could be "Develop and pilot a shared calendar template for clients by the end of next month."
- Review drivers in the "Unimportant Strengths" quadrant to see if resources can be reallocated.
Conclusion
In this lesson, we have established a sophisticated, data-driven framework for analyzing client satisfaction. You've learned to move from basic descriptive summaries to a powerful diagnostic tool—Key Driver Analysis—that provides a clear, prioritized roadmap for service improvement. By plotting your results on an Importance-Performance Matrix, you can instantly see where to focus your energy for maximum impact, ensuring your practice continually evolves to better meet the needs of your clients.
Key Takeaways:
- Diverging stacked bar charts are an effective way to visualize the distribution of Likert scale responses.
- Key Driver Analysis (KDA) identifies which service attributes have the greatest impact on overall client satisfaction.
- Relative Importance Analysis is a robust statistical method for KDA that handles the correlated nature of survey data better than standard regression.
- The Importance-Performance Matrix is a strategic tool that translates your analysis into an action plan by categorizing drivers into four quadrants: Key Strengths, Key Weaknesses, and areas of lower priority.
In our next lesson, we will focus on one very specific, but widely used, metric from your survey: the Net Promoter Score (NPS). We will cover its calculation, interpretation, and what it tells you about client loyalty and the potential for word-of-mouth growth for your practice.