Introduction
In our previous lesson, we built a framework for analyzing client satisfaction survey data using Key Driver Analysis, allowing you to prioritize service improvements based on what matters most to your clients. We now turn to another powerful metric you can derive from your post-engagement survey: the Net Promoter Score, or NPS. This lesson directly addresses the learning outcome: Calculate and interpret a Net Promoter Score (NPS) to gauge client loyalty.
While Key Driver Analysis helps you diagnose the internal mechanics of your service quality, NPS provides a single, high-level indicator of client loyalty and their willingness to act as advocates for your practice. We will cover the mechanics of its calculation, explore the nuances of what constitutes a "good" score, and, most importantly, design a systematic process for turning NPS feedback into tangible actions that build loyalty and drive referrals.
What is NPS and How is it Calculated?
The Net Promoter Score is based on a single, standardized question that you should include in your post-engagement survey:
"On a scale of 0 to 10, how likely is it that you would recommend my consulting services to a friend or colleague?"
Based on their response, clients are segmented into three distinct categories.
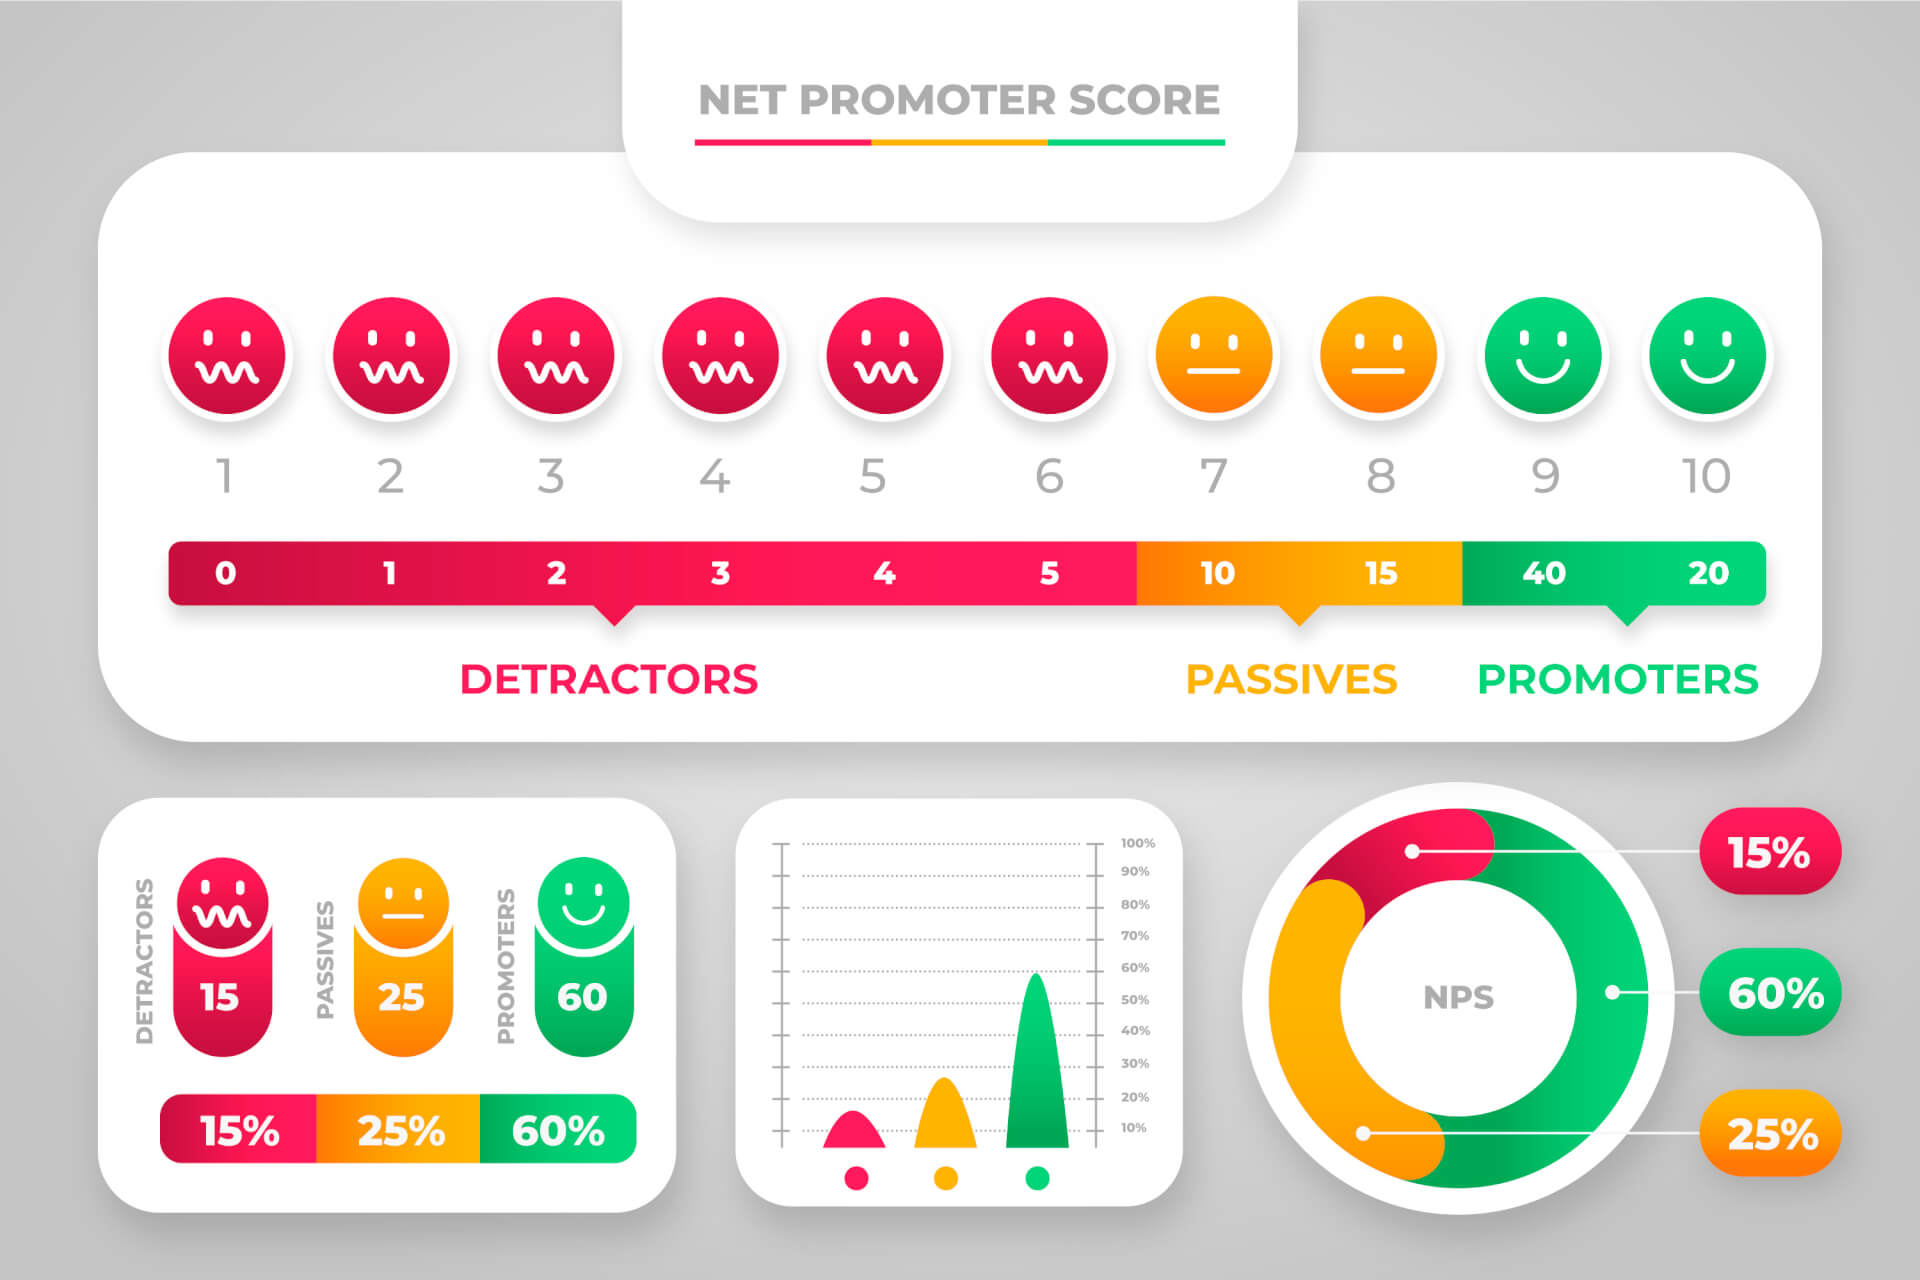
- Promoters (Score 9-10): These are your most enthusiastic and loyal clients. They are likely to be repeat clients and, crucially, act as brand ambassadors through word-of-mouth referrals.
- Passives (Score 7-8): These clients are satisfied but unenthusiastic. They got what they paid for but are not loyal and are vulnerable to competitive offerings. They are unlikely to recommend you proactively.
- Detractors (Score 0-6): These are unhappy clients. They may represent a churn risk and, in the worst case, can damage your reputation through negative word-of-mouth.
The NPS score itself is calculated with a simple formula: it's the percentage of Promoters minus the percentage of Detractors.
Note that the Passives are ignored in the final calculation, but their presence is still significant, as we'll discuss. The final score can range from -100 (all Detractors) to +100 (all Promoters).
To solidify your understanding of the definitions and the calculation, please review the following resource from SurveyMonkey.
Net Promoter Score Benchmarks: What Is A Good NPS?
This article provides a clear, concise overview of NPS, its respondent categories, and the calculation method.
Read the section NPS: An overview to review the definitions of Promoters, Passives, and Detractors. Then, carefully read the section How is your NPS score calculated? to see a step-by-step example of the formula in action.
The Anatomy of a Recommendation
To use NPS effectively, you must understand the mindset and behavior associated with each category. The score itself is just a number; the real insight lies in what each group represents for your practice.
The following video from ChurnZero provides an excellent deep dive into the "anatomy" of each respondent type.
NPS® – Using Net Promoter Score® to Drive Improvement
This video offers a detailed breakdown of the characteristics and business implications of Promoters, Passives, and Detractors.
Watch the segment from exploring the three categories. As you watch, focus on: Promoters: Why are they "business builders"? Note the point about them being willing to stake their own reputation on you. Passives: Why are they considered the "trickiest of the bunch"? Pay attention to the distinction between being satisfied but not happy, and their vulnerability to alternatives. Detractors: What is the shared trait between Detractors and Promoters? The insight that Detractors are passionate and represent your next potential Promoters is a powerful concept for a consultant.
As the video explains, your goal isn't just to increase the score. It's to cultivate Promoters, engage Passives to understand what's missing, and recover Detractors by addressing their concerns. Detractors, in particular, have invested emotional energy in the process and their feedback, while often difficult to hear, is incredibly valuable. Their passion, if successfully redirected, can make them your strongest advocates.
Interpreting Your Score: The Importance of Context
So, you've calculated your NPS. Let's say it's 45. Is that good? The answer is, "it depends." A raw NPS score is meaningless without context. As a statistician, you know that a point estimate needs a frame of reference to be interpretable. For NPS, there are two primary frames of reference.
The article from Qualtrics introduces this concept well.
What is a Good Net Promoter Score (NPS)? - Qualtrics
This resource distinguishes between two ways of interpreting your NPS, which is crucial for moving beyond a simple number.
Please read the section titled Absolute and relative NPS. Focus on the definitions of an "absolute" score (benchmarking against universal standards) versus a "relative" score (benchmarking against your own progress and competitors).
1. Absolute NPS: General Benchmarks
An absolute interpretation compares your score to general, cross-industry benchmarks.
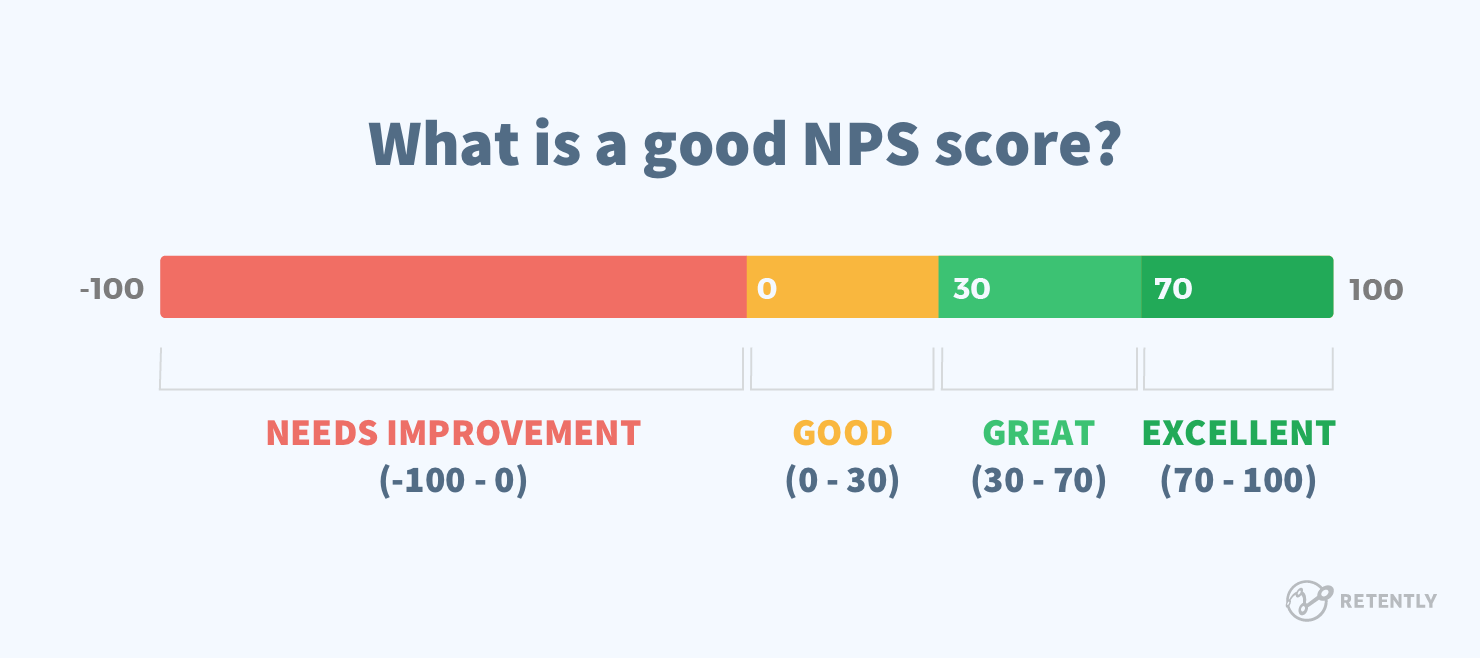
According to Bain & Company, the creators of NPS, a general guide is:
- Above 0: Good (More Promoters than Detractors)
- Above 20: Favorable
- Above 50: Excellent
- Above 80: World-Class
While these provide a rough guide, they are not specific enough to be truly strategic.
2. Relative NPS: Industry and Self-Benchmarking
A relative interpretation is far more powerful. It involves two comparisons:
- Against your industry: Different industries have different norms for customer satisfaction. A score of +20 might be a market-leading score in one industry but a poor score in another.
- Against yourself over time: This is arguably the most important benchmark. Is your NPS trending up or down? Tracking your score quarterly or biannually shows whether your service improvements are having a real impact on client loyalty.
For your specific practice, we can find relevant industry data. The "Consulting" sector provides the closest available benchmark.
Net Promoter Score Benchmarks: What Is A Good NPS?
This section of the SurveyMonkey article provides specific benchmark data for the consulting industry.
Find the subsection Consulting NPS benchmarks. Note the quartile scores: a median of 48 and an upper quartile of 72. This gives you a much more meaningful target than the general benchmarks.
This data tells you that a score of 48 would put you at the 50th percentile among consulting firms. To be in the top 25%, you would need a score of 72 or higher. This is your most relevant external target.
A Statistician's Critique of NPS
Before fully embracing NPS, it's important to approach it with the same rigor you would any other measurement tool. Given your background, you'll appreciate that while NPS is popular and motivationally powerful, it has several statistical limitations.
This video from Nielsen Norman Group provides a concise and cogent critique.
Downsides of the Net Promoter Score
This video highlights the statistical downsides of the NPS calculation method, offering a more nuanced perspective on the metric.
Watch the entire video, paying close attention to these points: The peculiar calculation method and how it ignores Passives. The main critique, starting at "ignores a lot of information," explains how treating a score of 0 the same as a 6 discards valuable information about the variance in your data. The consequence for your analysis, explained from margin of error, is that you need a larger sample size to achieve the same statistical confidence compared to simply using a mean rating.
Here are the key takeaways from a statistical viewpoint:
- Loss of Granularity: By collapsing an 11-point ordinal scale into three categories, you lose a significant amount of information. A client giving a 6 ("Detractor") is worlds apart from one giving a 0, yet the formula treats them identically.
- Higher Margin of Error: Because of this information loss, the NPS score is less efficient than a simple average. To achieve a desired margin of error (e.g., +/- 5%), NPS requires a substantially larger sample size than an average of the 0-10 scores would.
- Gaming the Metric: Its simplicity makes it susceptible to being gamed, for instance, by only surveying clients who had a smooth experience.
Your Protocol: Do not abandon NPS, but augment it. For your practice, the recommended protocol is to calculate and track both the official NPS and the mean of the 0-10 recommendation scores. The NPS is excellent for communication and motivation. The mean provides a more statistically stable and sensitive measure of client sentiment over time.
From Score to Action: The "Close the Loop" Protocol
The real value of NPS is not in the score itself, but in the system it enables. Simply tracking the number is a vanity exercise. Acting on the feedback is what drives improvement. This requires a "close the loop" protocol, where every single response receives a follow-up.
The ChurnZero video provides an outstanding framework for this.
NPS® – Using Net Promoter Score® to Drive Improvement
This part of the video details a comprehensive follow-up strategy, explaining the four loops of feedback and the importance of engaging every respondent.
Watch the segment on follow-up strategy. Focus on the "four loops" and the segmented approach to following up with Promoters, Passives, and Detractors. This section provides the blueprint for your own actionable protocol.
Here is a practical, tiered follow-up protocol you can implement for your practice:
-
Immediate Follow-up (Within 48 hours):
- For Promoters (9-10): Send a personal email expressing your gratitude. More importantly, mobilize their enthusiasm. Ask them for a specific action: "I'm so glad you had a positive experience. Would you be willing to write a short testimonial for my website?" or "Would you be open to me listing you as a reference for select potential clients?"
- For Passives (7-8): Send a personal email acknowledging their feedback. The key question here is, "Thank you for your feedback. I'm always looking to improve. Was there anything specific I could have done to make your experience a '10'?" This probes for the missing element and shows you are striving for excellence, not just satisfaction.
- For Detractors (0-6): This is your highest priority. For any high-value client, pick up the phone and call them. If not possible, send a carefully worded personal email. The goal is not to be defensive, but to listen. Say, "I'm sorry to see your experience wasn't what it should have been. I'm committed to understanding what went wrong and learning from it. Would you be open to a brief call to discuss your feedback?"
-
Thematic Analysis (Quarterly):
- Along with the 0-10 score, your survey should include an open-ended question like, "What was the most important reason for your score?"
- Aggregate and categorize the qualitative feedback from this question for Promoters, Passives, and Detractors separately.
- What themes drive enthusiasm? What themes cause dissatisfaction? This is a qualitative version of the Key Driver Analysis we discussed in the last lesson.
-
Strategic Review (Quarterly):
- Review your NPS score, your mean recommendation score, and the themes from your qualitative analysis.
- Compare these insights with your Importance-Performance Matrix from the KDA. Do they tell a consistent story?
- Use this integrated review to update your service delivery protocols and decide on the one or two most important areas for improvement in the next quarter.
Conclusion
In this lesson, we have demystified the Net Promoter Score, transforming it from a simple metric into a comprehensive system for gauging and growing client loyalty. You now have the tools to not only calculate the score but to interpret it with the necessary statistical and industry context.
Key Takeaways:
- NPS is calculated by subtracting the percentage of Detractors from the percentage of Promoters.
- A score's meaning is derived from relative context—comparing it to consulting industry benchmarks (median 48) and, most importantly, your own trend over time.
- While a powerful communication tool, NPS has statistical weaknesses. Augment it by also tracking the mean of the 0-10 scores for a more stable measure.
- The true power of NPS lies in a disciplined "close the loop" protocol: a segmented follow-up strategy to mobilize Promoters, engage Passives, and recover Detractors.
This lesson completes our focus on post-engagement evaluation tools. We have covered deep-dive satisfaction analysis with KDA and high-level loyalty tracking with NPS. In our final lesson of this module, we will look beyond the immediate post-engagement period and discuss how to develop a protocol for post-engagement check-ins to gather long-term outcome data, ensuring you understand the lasting impact of your work.