Introduction
In our previous lesson, we established the "why" and "what" of personalized intervention testing by exploring Single-Case Experimental Designs (SCEDs). You learned how to structure an A-B-A design to isolate the causal impact of your coaching strategies. The success of any such experiment, however, hinges on the quality and consistency of the data you collect. This brings us to today's focus: the "how."
This lesson directly addresses the learning outcome: create customized repeated-measures tracking tools for clients to monitor key variables. We will move from the experimental blueprint of an SCED to the tangible instruments your clients will use for data collection. For you, this is where your expertise in research methodology and efficiency converges. We will design tools that are not only methodologically sound but also streamlined for client use, minimizing burden while maximizing data integrity.
The Methodology of Momentary Assessment
The repeated measurements required for an SCED are formally gathered through a method called Ecological Momentary Assessment (EMA). This isn't just a diary; it's a research technique for capturing subjects' experiences, behaviors, and emotions in real-time within their natural environment.
The following review paper, while focused on older adults, provides an excellent and comprehensive overview of the EMA methodology that is broadly applicable.
Ecological Momentary Assessment to Measure Social ...
This paper provides a robust framework for understanding and implementing EMA. It outlines the core principles, variables, and protocols.
To begin, read the section within the 'Methods' that defines EMA and its key properties. This will establish our core vocabulary. Next, focus on the section titled "EMA of Social Connectedness and Other Contextual Variables." Pay attention to the three dimensions of measurement—structural, functional, and quality—and the inclusion of contextual variables like location and mood. This gives you a powerful framework for deciding what to measure. Then, examine the "EMA Protocols" section to understand the different prompting strategies (e.g., time-based vs. event-based) and typical assessment frequencies. Finally, review Table 1 and the accompanying paragraph. This table provides a brilliant conceptual map for categorizing variables across different time scales. Also, read the first paragraph of the 'Discussion' which addresses the crucial trade-off between data richness and client adherence.
As the paper details, the power of EMA lies in its ability to reduce recall bias and capture dynamic fluctuations in a client's state. When designing a tracking tool for your SCED, your first decisions will revolve around the EMA protocol:
- What to Measure: Will you track structural variables (e.g., number of dates per week), functional variables (e.g., feelings of loneliness), quality variables (e.g., satisfaction with an interaction), or a combination?
- Prompting Strategy: Will you use a time-based prompt (e.g., a daily "end of day" survey) or an event-based prompt (e.g., client fills out a short form immediately after a date)?
- Frequency and Duration: How often will the client report, and for how long? This must align with your SCED phases (e.g., daily for 1 week of baseline, 2 weeks of intervention, etc.).
Designing the Tool: From Construct to Question
Let's ground this in your consulting practice. A common goal for clients in the hotwife/cuckold lifestyle is to increase compersion, the feeling of joy one has from seeing their partner's happiness with another. How would you measure this as a dependent variable in an SCED?
Rather than inventing questions from scratch, you can leverage existing, validated psychometric scales. This lends significant credibility and rigor to your data. The COMPERSe Scale is a perfect example.
The Classifying Our Metamour/Partner Emotional Response Scale ...
This resource provides a ready-to-use, validated set of questions for measuring compersion.
Review the 11 items and the corresponding 5-point Likert scale. Note how the items are grouped into three distinct subscales in the "Scoring Procedures" section: Happiness, Sexual Arousal, and Excitement.
You could use these 11 questions as a daily or weekly tracking instrument. For an SCED, you would track the average score for one or all of these subscales across the baseline (A) and intervention (B) phases. A successful intervention aimed at increasing compersion should produce a noticeable and stable increase in the COMPERSe score during Phase B.
Beyond psychometric scales, you can design simple tracking items for other key variables relevant to your "efficiency expert" role, such as:
- Time Allocation:
- Time spent on lifestyle logistics (scheduling, communication) (in minutes)
- Time spent on dates (in hours)
- Subjective rating of work-life-lifestyle balance (1-10 scale)
- Relationship Quality:
- Number of arguments with primary partner today
- Satisfaction with communication today (1-10 scale)
The key is to create a parsimonious set of questions that directly targets the dependent variables of your experiment without overwhelming the client.
Building the Tool: From Questions to Application
A tracking tool can range from a simple paper journal to a sophisticated app. An ideal solution is somewhere in the middle: a digital tool that is easy for the client to use and automatically structures the data for your analysis.

Many commercially available journals, like this '5-Minute Journal for a Submissive Good Girl,' provide structure for reflection. However, they are typically qualitative and not designed for systematic data collection needed for an SCED. We will build a more data-centric version.
Tools like Google Sheets or Airtable are excellent for this. Airtable, in particular, functions as a user-friendly database, allowing you to create simple data entry forms for your clients and powerful dashboards for yourself.
The following video demonstrates how to build a KPI tracker in Airtable. While the example is for sales, the principles are directly transferable to building a client tracking tool.
[Airtable] Build Your KPI Tracker & Dashboard (In Less than 20 Minutes)
This video from Andrew Kroeze is a practical guide to leveraging Airtable for data collection and visualization.
Set up the Database: Watch the initial setup to understand how to create fields for your variables (e.g., 'Date', 'Client ID', 'COMPERSe_Q1', 'Time_Spent_Logistics'). This forms the backend of your tool. Create the Client Form: The most critical part for your client's experience is the data entry form. Watch how a simple web form is created from the database fields. This is what you would send to your client. Focus on the segment from creating the form to publishing it. Build the Dashboard: This is for you. Once data is collected, you need to visualize it. Watch how to create a dashboard with charts and summary numbers. The run charts shown are exactly what you would use to plot your SCED data. Pay attention to the sections on building charts and adding filters to view data by client or date range.
By following this model, you can create a professional, customized tracking system:
- Airtable Base: Create a table with columns for
Date,Client, and each variable you are measuring (e.g., the 11 COMPERSe items, time allocation, etc.). - Airtable Form: Generate a form from this table. You can make questions required and share a simple link with your client. They can bookmark this on their phone and fill it out daily.
- Airtable Interface (Dashboard): Create a private dashboard for your eyes only. Here, you can build charts that automatically update as your client submits data. A line chart with 'Date' on the x-axis and the average 'Compersion Score' on the y-axis becomes the visual representation of your A-B-A design.
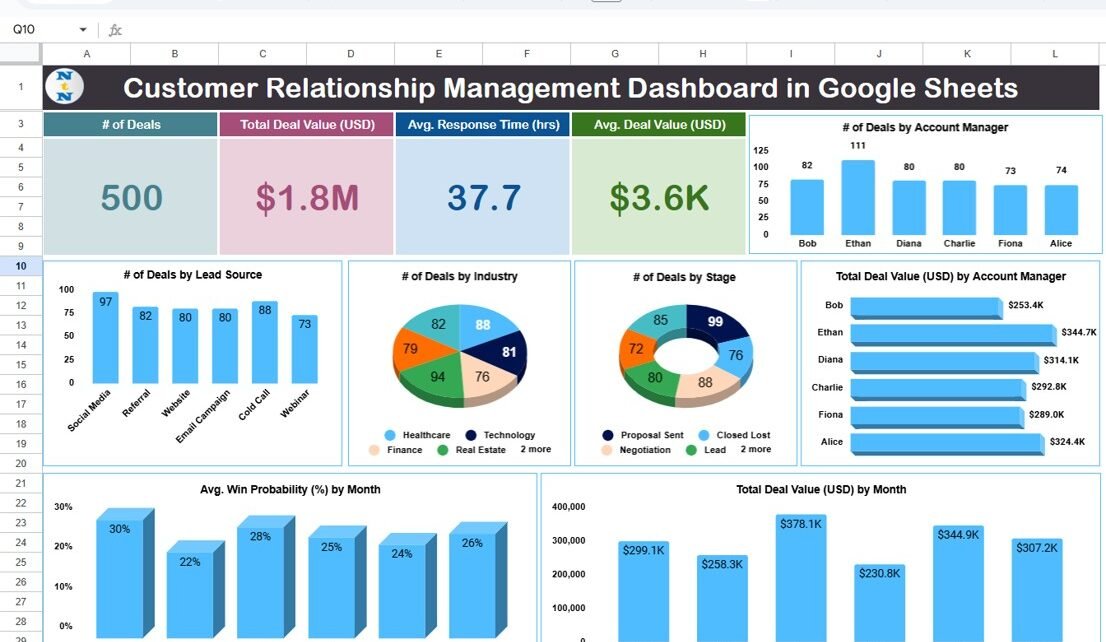
This CRM dashboard is a great example of the professional data visualization you can create with a tool like Airtable. You can build a similar interface to track client progress against their goals in real-time.
Advanced Considerations: Passive and Active Data
As you systematize your practice, you can even explore the frontier of data collection discussed in the EMA paper: integrating passive data.
Ecological Momentary Assessment to Measure Social ...
This final reading touches on advanced data collection methods and ensuring client adherence.
Read the discussion on passive sensing, such as phone usage logs or GPS data. While more complex to implement, this points toward a future where you can supplement self-report (active) data with objective (passive) data. Finally, review the practical advice on client training. Onboarding your client to the tool effectively is just as important as the tool's design itself.
For now, focusing on a well-designed active data collection tool using Airtable is a significant step forward. It provides the empirical backbone for your single-case experiments and immediately elevates the scientific rigor of your practice.
Conclusion
Today, we've translated the abstract need for "repeated measures" into a concrete, actionable workflow. You've learned how to design and build the very tools that will power your data-driven coaching practice.
Key Takeaways:
- EMA is the Method: Ecological Momentary Assessment is the formal methodology for collecting in-the-moment data, reducing bias and capturing the dynamics of your client's experience.
- Measure What Matters: Use a framework of structural, functional, and quality dimensions to select your variables. Leverage validated scales like COMPERSe to add rigor.
- Balance Rigor and Usability: An effective tracking tool gathers enough data for analysis without creating excessive burden on the client.
- Tools Enable Systematization: Platforms like Airtable allow you to create simple data entry forms for clients and powerful, real-time dashboards for yourself, turning raw data into actionable insights.
You now have both the experimental design (SCED) and the data collection instrument (EMA tracker). The next step is to analyze the data as it comes in. In our next lesson, we will explore how to apply Bayesian reasoning to conceptually update your beliefs about an intervention's effectiveness with each new data point, a method perfectly suited to the iterative, N-of-1 nature of coaching.