Introduction
In our previous lesson, you established a rigorous protocol for evaluating your instrument's content validity, ensuring that its questions are relevant and comprehensive. You now have a tool that, in principle, measures the right constructs. The crucial next step is to move from theory to practice by testing how the instrument performs with real people. This process is known as pilot testing, and its primary goal is to assess reliability.
This lesson focuses on the learning outcome: Design a pilot test to assess the instrument's reliability (e.g., test-retest, Cronbach's alpha) and revise items accordingly. Reliability answers the question: "Does my instrument measure constructs consistently?" We will cover two key types of reliability: internal consistency, which assesses whether items on a scale work together, and test-retest reliability, which evaluates the stability of your instrument over time. You will learn to design the pilot test protocol, analyze the resulting data using appropriate statistical methods, and make data-driven decisions to refine your questionnaire into a robust diagnostic tool.
1. Designing Your Pilot Study Protocol
A pilot test is a small-scale trial run of your questionnaire with a sample of your target population. While a major output is statistical data on reliability, the process also yields invaluable qualitative feedback.
Question types & piloting. Part 1 of 3 on Questionnaire Design
This video by Graham R Gibbs provides an excellent overview of the purpose and practice of piloting. It highlights that piloting is not just a mechanical step, but a crucial discovery phase.
Please watch the following segments to understand the key considerations: The purpose of piloting: Focus on how piloting reveals the assumptions built into your questions and exposes you to how respondents actually think. Why pilot a questionnaire?: This section details the main goals, including evaluating question quality, assessing phrasing, and checking the overall structure. A pilot checklist: Pay close attention to this practical list of issues to look for, such as variation in answers, redundancy, non-responses, flow, and timing.
As the video illustrates, your pilot test protocol should be designed to capture both quantitative data for statistical analysis and qualitative data for practical improvements. Here is a blueprint for your protocol:
a) Define Reliability Goals:
You need to assess two primary forms of reliability:
- Internal Consistency: Do the items intended to measure a single construct (e.g., "Emotional Integration") actually produce similar scores? This is about the cohesion of a scale. We use Cronbach's Alpha for this.
- Test-Retest Reliability: If a client takes the questionnaire today and again in two weeks, will their scores be stable (assuming no significant life event has occurred)? This is about the instrument's stability over time. We use the Intra-class Correlation Coefficient (ICC) for this.
b) Determine Your Sample Size:
For a pilot study focused on reliability, you do not need a large sample. A common and well-justified rule of thumb is a minimum of 30 participants.
Sample size determination for conducting a pilot study to assess ...
This article provides a clear, evidence-based guide for determining the minimum sample size needed for a reliability-focused pilot study. Given your background, the statistical justification will be particularly relevant.
Please read the following sections: Start with the Introduction to understand the formal definition and purpose of a pilot study. Read the description of the three reliability tests to see the formal distinction between Kappa (for categorical data), ICC (for test-retest on numerical data), and Cronbach's Alpha (for internal consistency). Note the important critique of using Pearson's correlation for test-retest. Review the section on Findings, which summarizes the sample size calculations. Finally, look at the example statement for Cronbach's alpha. This demonstrates how to justify a sample size of 30, accounting for a 20% non-response rate.
As the article confirms, a sample size of around 30 is sufficient for assessing reliability with adequate statistical power. This is distinct from the larger samples required for validity analyses like Exploratory Factor Analysis (EFA), which you might consider later.
c) The Pilot Procedure:
- Recruit: Identify ~30-35 individuals representative of your client base.
- Administer (Time 1): Have them complete the questionnaire.
- Gather Qualitative Feedback: Immediately after completion, ask them questions based on the checklist from the Gibbs video. A "think-aloud" protocol, where a few participants talk through their thought process as they answer, can be especially insightful. Key questions include:
- "Were any questions unclear or confusing?"
- "Did any terms mean something different to you than what you think I intended?"
- "Did any parts feel repetitive?"
- "How long did it take you to complete?"
- Administer (Time 2): For test-retest reliability, ask the same participants to complete the questionnaire again after a 2-week interval.
2. Analyzing Internal Consistency with Cronbach's Alpha
Once you have your pilot data, the primary task is to assess the internal consistency of each scale (or subscale) in your instrument. Cronbach's alpha is the standard metric for this.
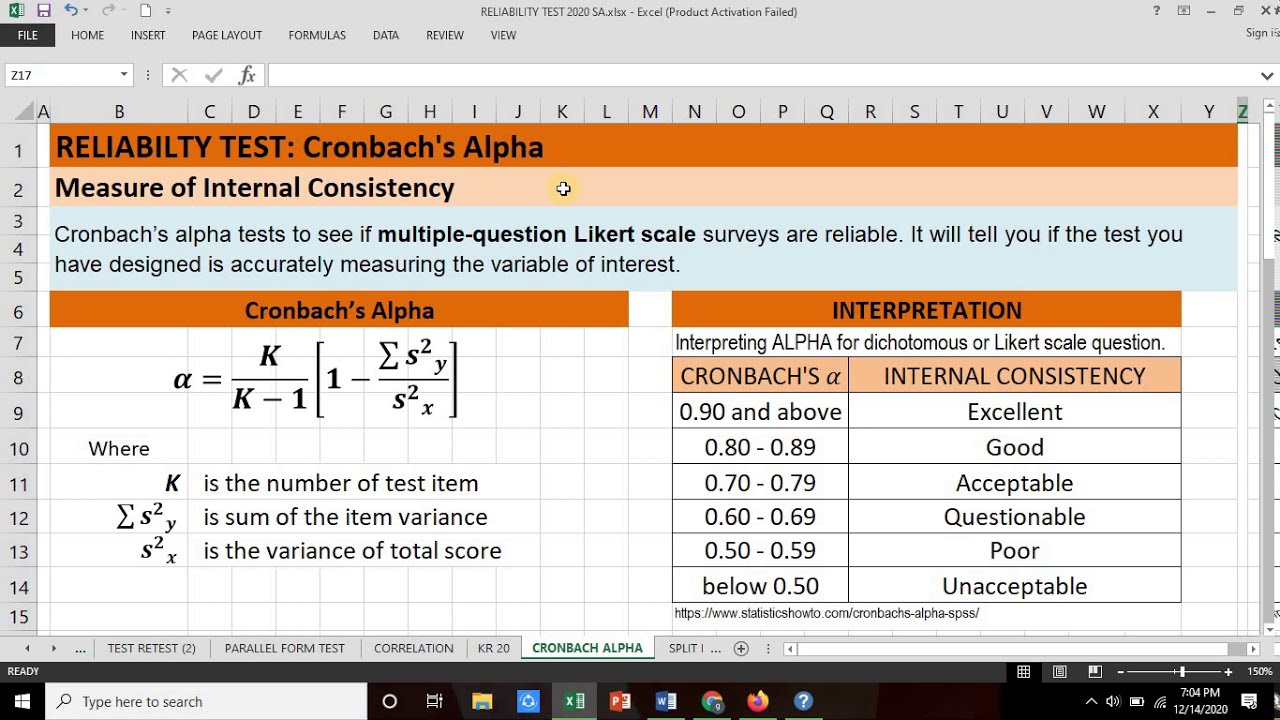
While the overall alpha value is important, a deeper item-level analysis is required to truly refine your instrument. This is where you leverage your statistical skills to go beyond a single number. The core of this process is an item analysis.
Chapter 7 Item Analysis for Likert Type Scale Construction
This chapter provides a comprehensive, practitioner-focused guide to conducting an item analysis, using R for its examples. It walks through the exact steps needed to evaluate and revise items based on their statistical properties.
Please read the following sections carefully: Introduction to Item Analysis: This defines the goal—selecting items that create a cohesive scale. Workflow for Item Analysis: This outlines the three-step process. Pay close attention to the flowchart and the description of Step 1. Step I: Corrected item-total correlations: This is the most critical section. It explains the concept and the iterative process of making decisions based on both statistics and construct definition. Calculating Item-Total Correlation Coefficients: This section provides an example of R output from the psych::alpha function. Focus your attention on the interpretation of the r.drop column (the corrected item-total correlation) and the "Reliability if an item is dropped" table.
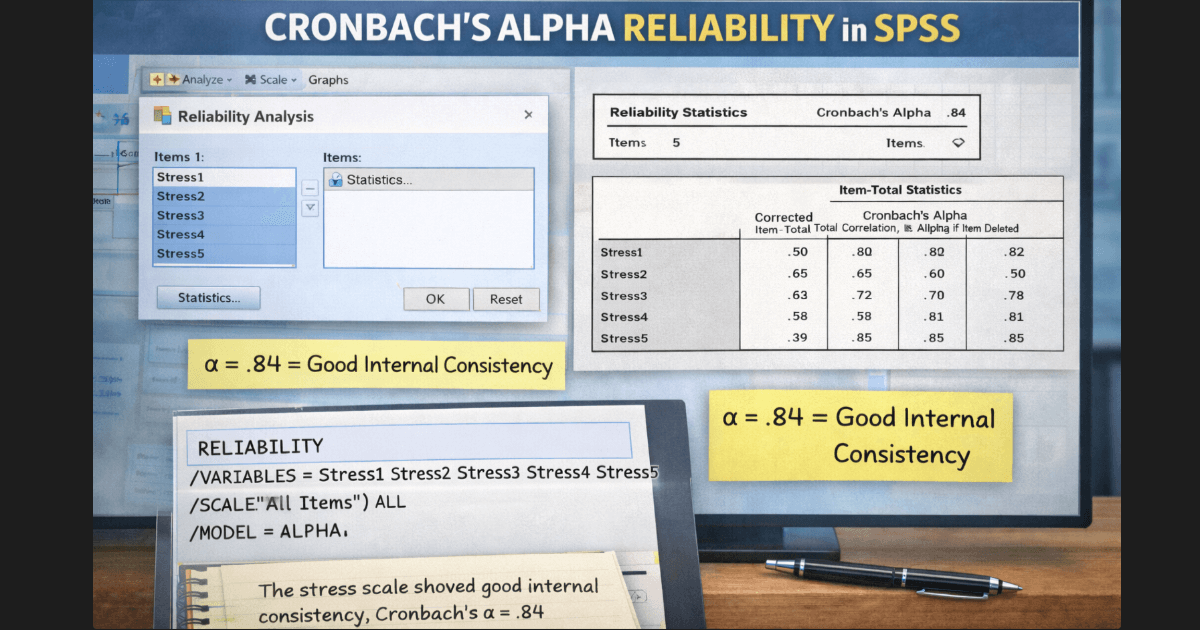
The reading introduces the key concepts for your analysis. Here's how to apply them:
The Item Analysis Workflow:
- Calculate Overall Alpha: For each scale (or subscale), run a reliability analysis to get the overall Cronbach's Alpha.
- Examine Corrected Item-Total Correlations (
r.drop): This value shows the correlation of a single item with the total score of the other items on the scale.- High
r.drop: Indicates the item is consistent with the rest of the scale. (e.g., > 0.40) - Low
r.drop: Indicates the item may not be measuring the same construct as the other items. These are candidates for revision or deletion.
- High
- Examine "Alpha if Item Deleted": This tells you what the scale's alpha would become if you removed that one item.
- If removing an item increases the alpha, that item is harming the scale's internal consistency and is a strong candidate for deletion.
- If removing an item decreases the alpha, it contributes positively to the scale's reliability.
The Revision Loop:
This is an iterative process.
- Identify the "worst" item (lowest
r.drop, or one whose removal most increases alpha). - Remove that single item.
- Re-run the entire reliability analysis on the remaining items. The total score and all correlations have now changed.
- Repeat until you have a scale with an acceptable overall alpha and where all remaining items contribute positively.
For Multi-dimensional Instruments:
Your diagnostic tool will likely have several subscales (e.g., "Logistical Management," "Emotional Jealousy," "Compersion").
- You must run a separate item analysis for each subscale.
- For advanced refinement, you should also check for discriminant evidence. As described in the "Item Analysis for Likert Type Scale Construction" reading, an item should correlate more strongly with its own subscale's total score than with the total scores of other subscales. This confirms that your subscales are measuring distinct concepts.
3. Analyzing Test-Retest Reliability
After analyzing internal consistency, the second step is to assess your instrument's stability over time using the data from your Time 1 and Time 2 administrations. The appropriate statistic here is the Intra-class Correlation Coefficient (ICC).
As mentioned in the "Sample size determination" paper, Pearson's correlation is not suitable because it only assesses the strength of a linear relationship, not true agreement. For instance, if every participant's score increased by exactly 5 points from Time 1 to Time 2, Pearson's correlation would be a perfect 1.0, but the test would have poor reliability because the scores themselves are different. The ICC, on the other hand, is sensitive to these systematic shifts and measures true agreement.
Procedure:
- Match the Time 1 and Time 2 data for each participant.
- Calculate the ICC for the total score of each scale and subscale.
- Interpret the ICC values. A common guideline is:
- < 0.50: Poor
- 0.50 - 0.75: Moderate
- 0.75 - 0.90: Good
-
0.90: Excellent
If you find poor test-retest reliability, it suggests that your questions may be too ambiguous or are measuring a state that is highly volatile, prompting a review of the item wording for clarity.
Conclusion
In this lesson, you have learned how to design and execute a pilot test to move your instrument from a content-validated draft to a statistically reliable tool. This process of empirical testing is a cornerstone of rigorous instrument design and is fundamental to building an evidence-based consulting practice.
Key Takeaways:
- A pilot test is a small-scale trial run (~30 participants) to assess an instrument's reliability and gather qualitative feedback.
- Internal Consistency, measured by Cronbach's Alpha, assesses how well items on a scale measure a single, unified construct.
- Item analysis, using the corrected item-total correlation (
r.drop) and alpha-if-item-deleted statistics, is an iterative process to identify and remove items that weaken a scale's reliability. - Test-Retest Reliability, measured by the Intra-class Correlation Coefficient (ICC), assesses the instrument's stability and consistency over time.
- The results of the pilot test provide a data-driven mandate for revising, retaining, or removing items to create a final, robust questionnaire.
With a validated and reliable diagnostic instrument now in hand, the next step is to integrate it into your client work. In the next module, we will shift focus to The Diagnostic and Strategy Session, where you will learn to synthesize the quantitative data from your questionnaire with the qualitative client narrative to co-create measurable goals and lay the foundation for a successful coaching engagement.