Welcome back. In our previous lessons, we delved into the two fundamental forces that govern system behavior: negative feedback, which creates stability and regulation, and positive feedback, which drives growth and instability. You now have a conceptual grasp of these balancing and reinforcing dynamics. However, to truly analyze and design complex systems, we need a way to move beyond intuition and map these forces visually.
This lesson provides you with that essential tool. Our objective is to learn how to visualize feedback structures using Causal Loop Diagrams (CLDs). We will treat CLDs as a formal language, breaking down its components—its "nouns," "verbs," and "grammar"—so you can read, interpret, and ultimately construct clear and insightful diagrams. This skill is the bridge between your abstract understanding of feedback and the practical analysis of a system's structure, a crucial step towards your goal of designing cybernetic systems.
1. The Language of CLDs: Variables, Links, and Polarity
At its core, a Causal Loop Diagram tells a story about how things influence one another within a system. Like any language, it has fundamental components. The "Causal Loop Diagrams Handbook" provides an excellent, structured overview of these building blocks.
Causal Loop Diagrams Handbook - Cascade Institute
This handbook offers a clear and formal introduction to CLDs. It will serve as our primary reference for the syntax of this language.
First, read the brief introduction to understand the purpose of CLDs. Then, focus on the sections titled "Elements" and "Connections" (pages 4-5). Pay close attention to the definitions of variables, positive causal relationships (+), and negative causal relationships (-).
Let's break down these core components:
- Variables (the "Nouns"): These are the key elements of your system. As the handbook states, the most important rule is that a variable must be something that can increase or decrease over time. "Revenue," "Population," and "Stress Level" are good variables. "The Company" or "A Person" are not, because they are actors, not quantifiable states. You could, however, use "The Company's Profitability" or "A Person's Skill Level."
- Links (the "Verbs"): These are the arrows that connect variables, representing a causal influence. An arrow from A to B means that A causes B to change.
- Polarity (the "Adjectives"): Each link has a polarity sign (
+or-) that describes the relationship.- Positive Polarity (
+): The two variables move in the same direction. If the cause increases, the effect increases. If the cause decreases, the effect decreases. This is sometimes labeled with an 's' for 'same'. - Negative Polarity (
-): The two variables move in opposite directions. If the cause increases, the effect decreases. If the cause decreases, the effect increases. This is sometimes labeled with an 'o' for 'opposite'.
- Positive Polarity (
The video "Systems Thinking: Causal Loop Diagrams," which we viewed briefly in the last lesson, provides a great animated recap of these components.
Systems Thinking: Causal Loop Diagrams
This video visually reinforces the concepts of variables, links, and polarity.
Watch the segments from the beginning to understand the components. The explanation of how births and deaths affect population is a classic and clear example of positive and negative polarities.
2. Assembling the Loops: Reinforcing and Balancing
Once we connect variables with links, they often form closed circuits of cause and effect—these are the feedback loops we've been studying. A CLD not only shows the individual relationships but also labels the overall behavior of the loop itself.
- Reinforcing Loops (R): These are the positive feedback loops we studied last time. They amplify change, leading to exponential growth or collapse. A reinforcing loop is labeled with an 'R' or a snowball symbol ( snowball rolling downhill).
- Balancing Loops (B): These are the negative feedback loops that seek stability and equilibrium. They counteract change, pushing the system toward a goal. A balancing loop is labeled with a 'B' or a balance scale symbol (⚖).
How do you determine if a loop is reinforcing or balancing? You can trace the story, but there's a simple algorithmic shortcut: Count the number of negative (- or o) links in the loop.
- An even number of negative links (including zero) results in a Reinforcing (R) loop.
- An odd number of negative links results in a Balancing (B) loop.
Let's see this in action by continuing our reading of the handbook.
Causal Loop Diagrams Handbook - Cascade Institute
This reading will show you how the components combine to form the two fundamental loop types.
Read the sections on "Positive Feedback Loops" and "Negative Feedback Loops" (pages 6-12). Note how a reinforcing loop can be made of two negative links (the "Matthew effect" example). Then, read about "Multifactor Feedback Loops" (pages 13-15), which introduces the counting shortcut.
The article "Causal Loop Construction: The Basics" provides another walkthrough of this process, framing it as a four-step storytelling method.
Causal Loop Construction: The Basics
This article offers a practical, step-by-step guide to building a CLD.
Read the entire article, from start to finish. It walks through a great case study of a Total Quality Management (TQM) program, showing how to identify variables, link them, label the loops, and finally "talk through" the story the diagram tells.
3. The Nuances of Causality and Clarity
The power of a CLD lies in its clarity, but this requires careful thought. Two important nuances are the nature of causality itself and the role of delays.
The "Causal" in CLD
Your background in computer science and interest in philosophy will make this next point particularly relevant. In a formal system or a physical equation, causality can often be treated as a definitive, almost mechanical relationship. In the complex social systems cybernetics often deals with, the term "causal" is more of an operational definition. It implies a consistent, predictable influence, all else being equal.
The following segment from an MIT OpenCourseWare lecture on System Dynamics features a discussion that touches on precisely this point, distinguishing the physicist's view of causality from the modeler's pragmatic approach.
System Dynamics: Systems Thinking and Modeling for a Complex World
This clip provides a deeper, more philosophical perspective on what we mean by "causality" when we model complex social systems.
Watch the segment from this discussion between the lecturer and a student with a physics background. It highlights that in system dynamics, causality is a pragmatic assumption about consistent relationships, which allows us to build useful models even if we can't prove causality in a strict, philosophical sense.
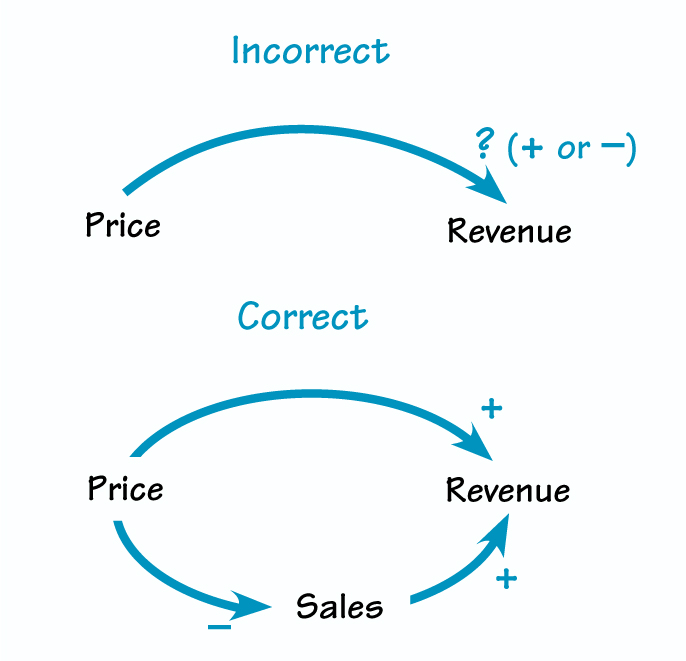
This pragmatic view leads to a vital rule of thumb: if you are struggling to assign a single polarity (+ or -) to a link, it's a sign that your model is too simple. The relationship is likely not directly causal; there is a missing variable in between that clarifies the mechanism.
Consider the link between "Price" and "Revenue." Does increasing price increase revenue? It depends. If demand is inelastic, yes. If demand is elastic, raising the price too much could decrease sales so sharply that overall revenue falls. The relationship is ambiguous. The correct approach is to introduce the intermediate variable, "Sales."
Delays
Effects are rarely instantaneous. It takes time for a student's effort to translate into skill, for a marketing campaign to build brand awareness, or for a new factory to be built. These time lags, or delays, are a critical feature of a system's structure and often a source of surprising behavior (like oscillation).
In CLDs, delays are typically marked with a double slash // or a similar symbol on the causal link.
Systems Thinking: Causal Loop Diagrams
Let's return to our first video to see how delays are visualized.
Watch the section explaining delays. The example of the time it takes for a population to mature and reproduce is a perfect illustration of why this concept is so important.
Forgetting to mark a significant delay is a common mistake. It can lead you to misinterpret how quickly a system will respond to a change.
4. Guidelines for Effective Diagramming
Like writing clear code or a logical proof, drawing a good CLD is a craft. It requires adhering to certain conventions to ensure your diagram is readable, accurate, and insightful. The image below provides an excellent summary of ten key guidelines.
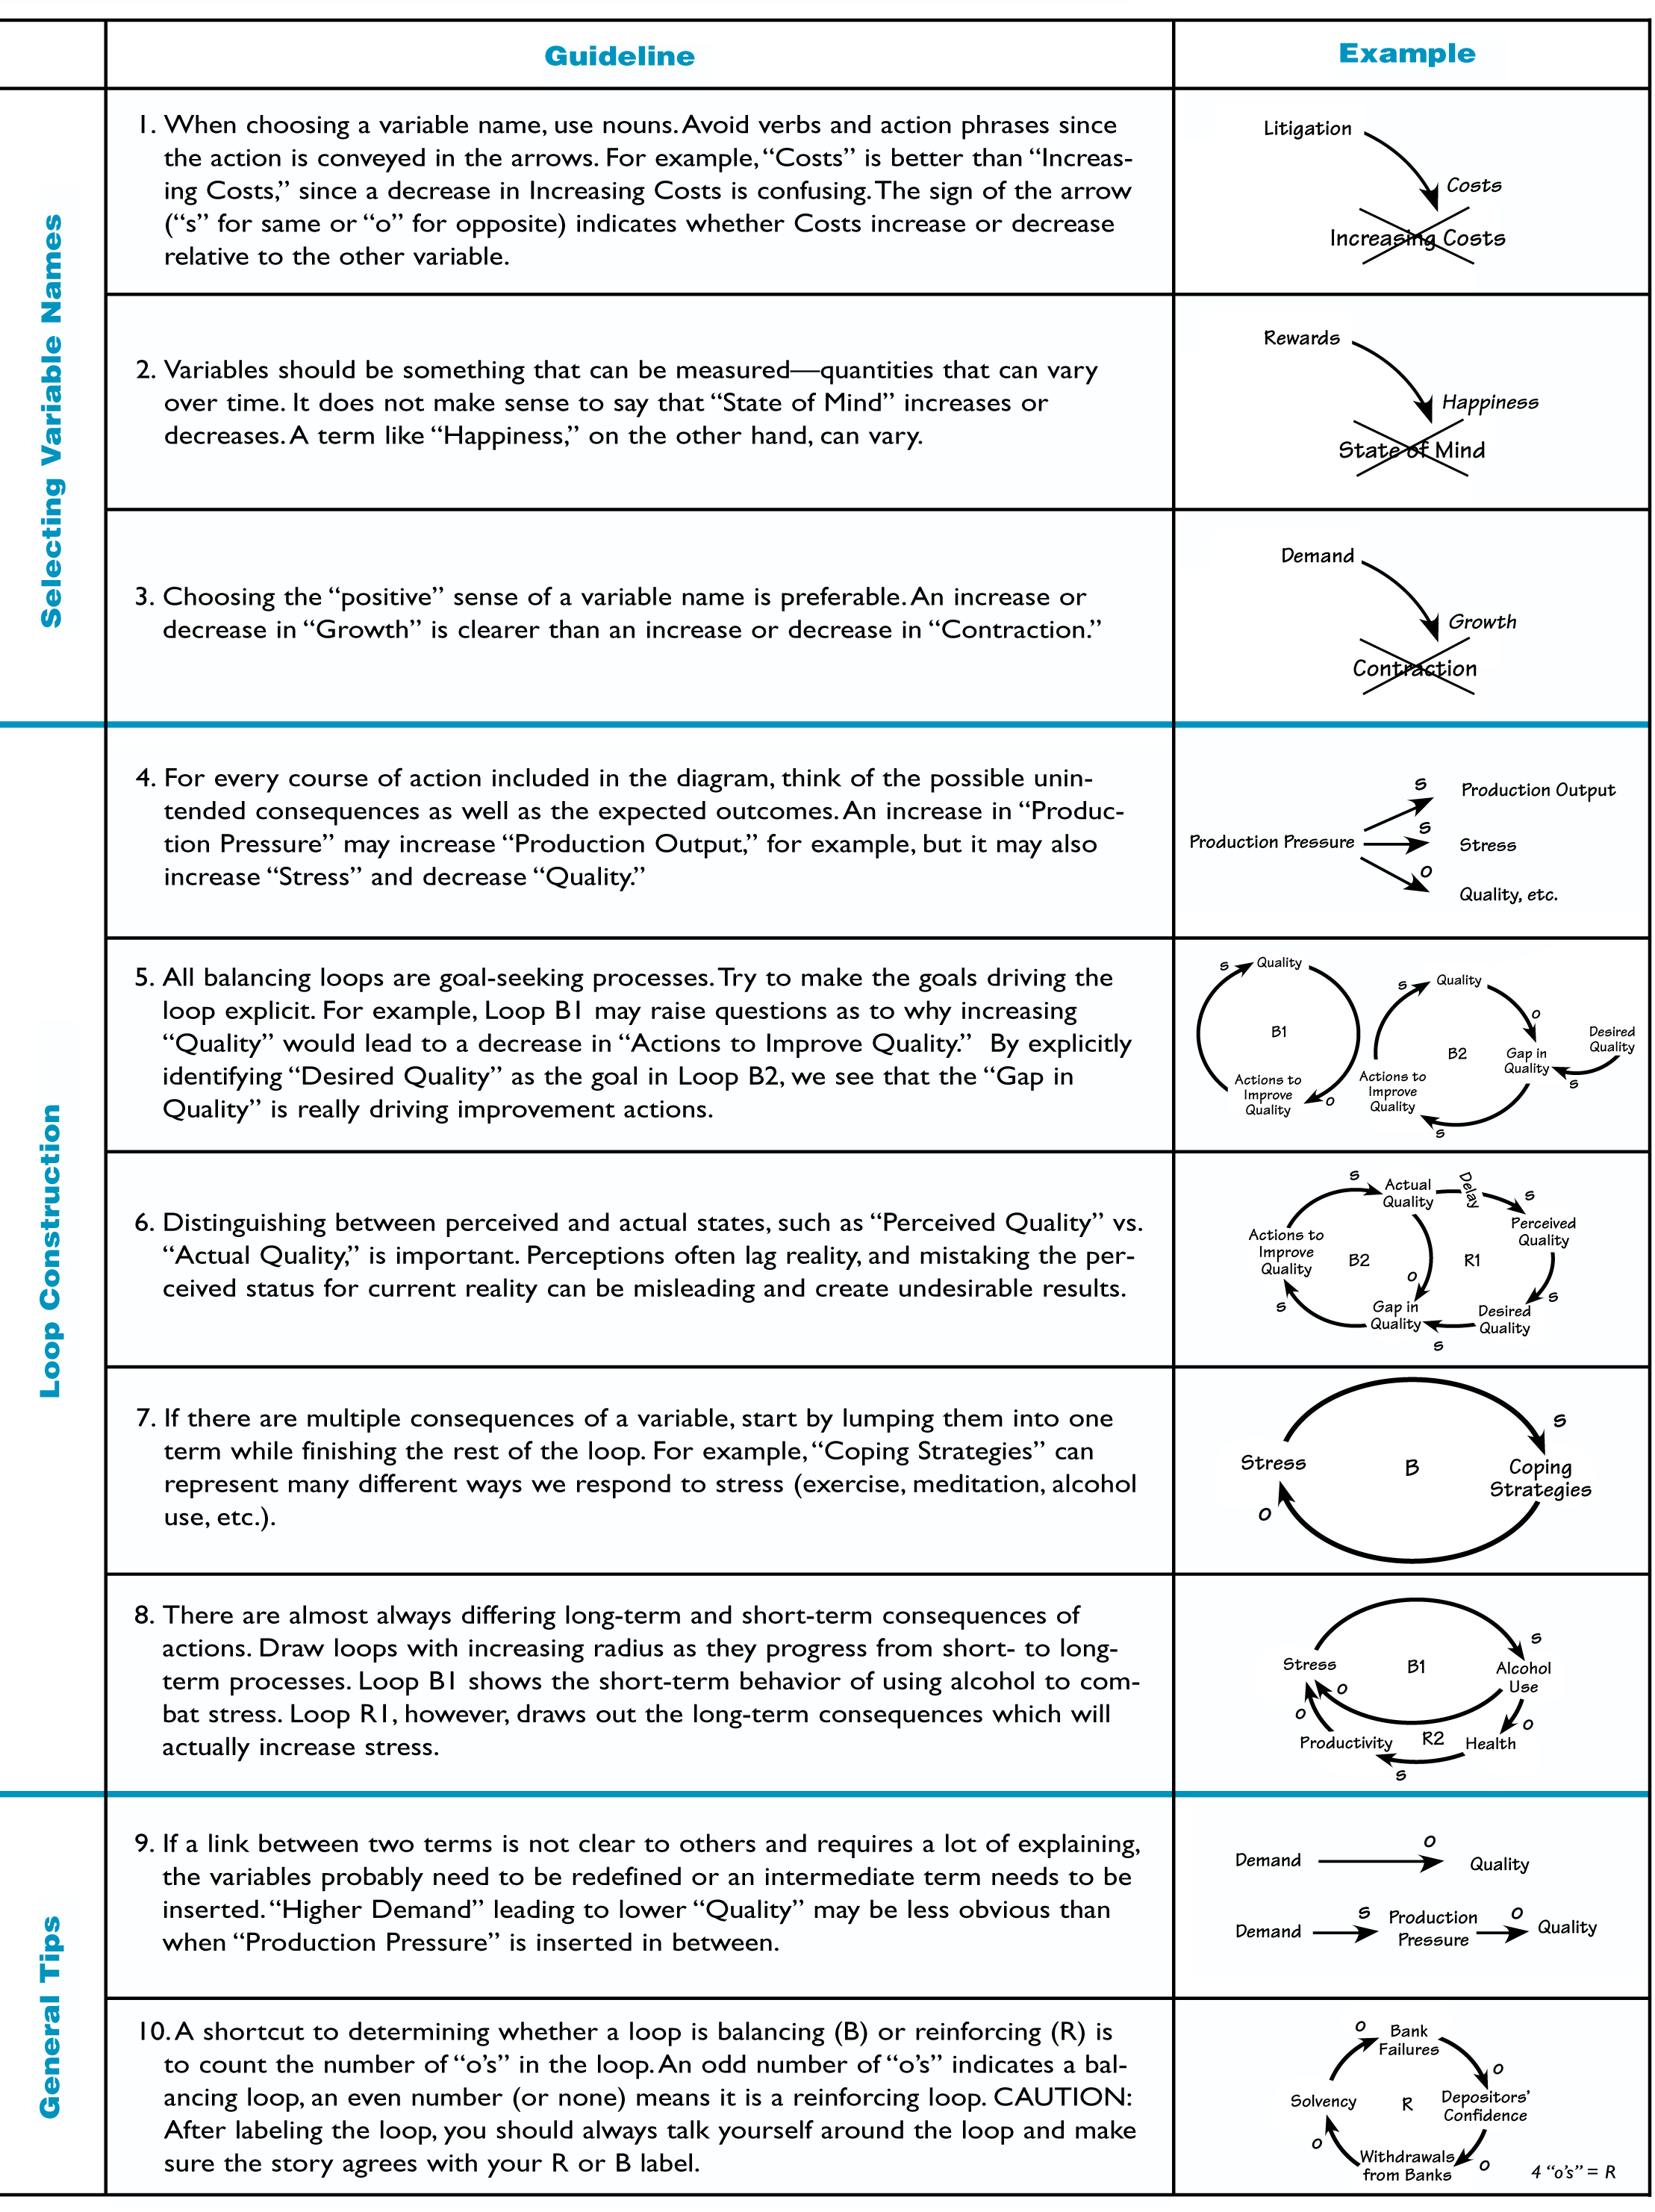
Let's highlight a few of the most important rules from this chart:
- Use Nouns, Not Verbs, for Variables (Guideline 1): Name variables "Costs," not "Increasing Costs." The change is shown by the link's polarity, not the variable's name.
- Choose the "Positive" Sense of a Variable (Guideline 3): Use "Growth" rather than "Contraction," or "Quality" rather than "Number of Defects." This makes reading the
+and-links more intuitive. An increase in "Growth" is positive, but an increase in "Contraction" is negative, which can be confusing. - Distinguish Between Perceived and Actual States (Guideline 6): Our decisions are often based on what we perceive to be true, not what is true. "Perceived Quality" and "Actual Quality" can be very different, and modeling that gap is often key to understanding a system.
- Don't Hesitate to Add Intermediate Variables (Guideline 9): As we saw with the Price-Revenue example, if a link needs a long explanation, you are probably missing a variable.
To put this all together, let's review a formal set of instructions for creating a CLD.
Causal Loop Diagrams Handbook - Cascade Institute
This section of the handbook provides a concise, step-by-step process for creating a CLD, consolidating the advice we've discussed.
Read the section titled "Step-by-Step Instructions" (pages 16-18). It formalizes the process from identifying elements to drawing the diagram and articulating the narrative.
As a final piece of practical advice, from the same MIT lecture, a simple way to begin is to just start.
System Dynamics: Systems Thinking and Modeling for a Complex World
Here is a simple, practical tip for getting started on your first diagram.
Watch this short clip on how to start. The advice is beautifully simple: write the thing you care about in the middle of a whiteboard and start asking "what causes this to go up or down?"
Conclusion
In this lesson, we have unpacked the language of Causal Loop Diagrams. You now understand the fundamental grammar needed to visualize the feedback structures that drive system behavior.
Here are the key takeaways:
- CLDs are a visual language for mapping the feedback structure of a system.
- The core components are variables (nouns), causal links (arrows), and polarity (
+for same-direction change,-for opposite-direction change). - These components form Reinforcing (R) and Balancing (B) loops, which you can identify by counting the number of negative links (even/zero = R, odd = B).
- Clarity is paramount: be precise with causality, add intermediate variables to resolve ambiguity, and always indicate significant delays.
You have learned the rules of the language. In our next lesson, we will begin to practice fluency. We will move from theory to application as you construct CLDs to represent simple balancing and reinforcing loops in various systems, putting this powerful tool to work.