In our last session, we learned the formal language of Causal Loop Diagrams (CLDs), exploring the "grammar" of variables, links, polarities, and loop identifiers. You now know how to read and interpret a CLD, much like learning the syntax of a new programming language. Today, we transition from reading to writing.
Our goal is to construct CLDs to represent simple balancing and reinforcing loops in various systems. This lesson is a hands-on workshop where you will apply the rules we've learned to translate descriptions of systems into clear, insightful diagrams. Mastering this skill is fundamental, as it allows you to formalize your thinking about a system's structure, a necessary step before you can analyze its behavior or, as is your ultimate goal, design a new one.
1. Constructing a Simple Reinforcing Loop
Let's begin with a classic example of a reinforcing process: compound interest in a bank account. The core idea is that the money in the account generates interest, which is then added back to the account, allowing it to generate even more interest. It's a "snowball" effect.
How do we model this? We follow a systematic process:
- Identify Key Variables: What quantities are changing? The most obvious are the
Bank Balanceand theInterest Earnedper period. - Establish Causal Links and Polarity: How do they influence each other?
- An increase in
Bank Balancecauses an increase inInterest Earned(assuming a fixed interest rate). So, we draw a link fromBank BalancetoInterest Earnedwith a+polarity. - An increase in
Interest Earnedcauses an increase inBank Balance. This is another+link, this time fromInterest Earnedback toBank Balance.
- An increase in
- Identify the Loop: We have a closed loop!
Bank Balance→Interest Earned→Bank Balance. To determine its type, we count the negative links. There are zero, which is an even number. Therefore, this is a Reinforcing (R) loop.
The following video clip provides a quick, clear visualization of this and other reinforcing loops.
Systems Thinking: Causal Loop Diagrams
This video from our previous lesson will help refresh your memory on how reinforcing loops like the bank account example are visualized.
First, re-watch the segment explaining the fundamental structure of a reinforcing loop using the population example. Then, watch the specific example of interest in a bank account.
The resulting diagram is simple but powerful. It clearly shows the self-amplifying structure that leads to exponential growth.
A simple reinforcing loop diagram for a bank account. An increase in the 'Bank Balance' leads to more 'Interest Earned', which in turn increases the 'Bank Balance', creating a cycle of growth.
2. Constructing a Simple Balancing Loop
Balancing loops are goal-seeking. They work to close a gap between a current state and a desired state. A perfect example is a home heating system. The furnace works to bring the room temperature up to the thermostat's setting.
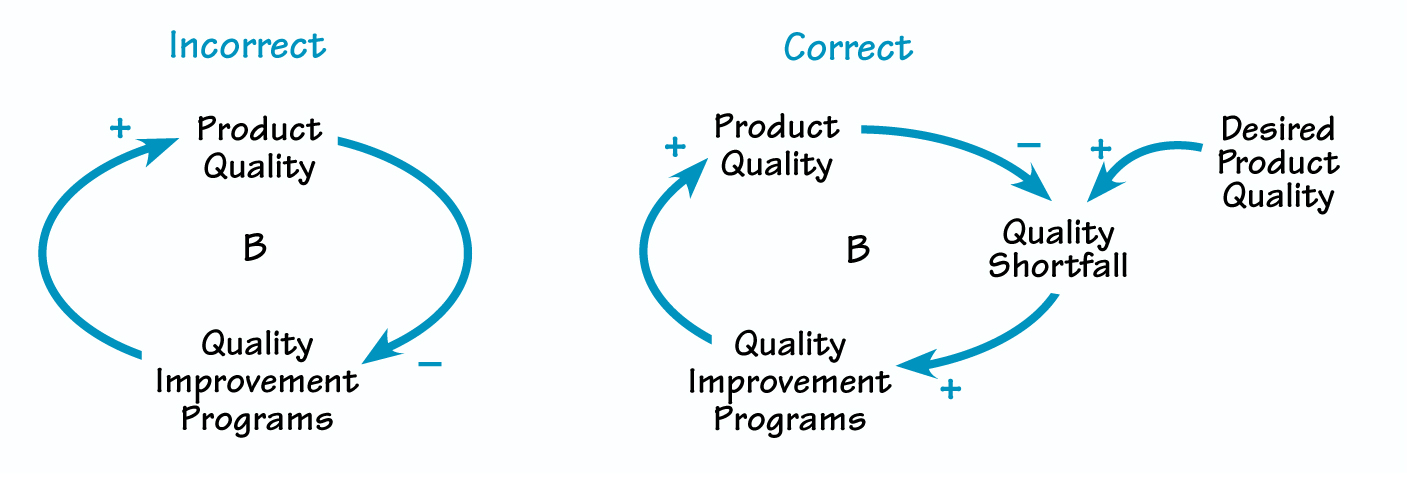
A common mistake when modeling balancing loops is to draw a direct, but ambiguous, link. For instance, Product Quality → Quality Improvement Programs. Does higher quality lead to more or fewer improvement programs? It's unclear.
As we saw in the guidelines from our last lesson, the key is to make the goal explicit. The image below illustrates this perfectly. Instead of a direct link, the "Correct" diagram introduces a Quality Shortfall variable. The improvement programs are driven by this shortfall, not by the quality itself.
Let's apply this "explicit goal" principle to our thermostat example:
- Identify Key Variables: We need the
Current Temperature, theDesired Temperature(the goal, set on the thermostat), theTemperature Gap(the difference between desired and current), and theFurnace Activity. - Establish Causal Links and Polarity:
- The
Temperature Gapis determined by both theDesired Temperatureand theCurrent Temperature. An increase inCurrent Temperaturedecreases the gap (a−link). An increase inDesired Temperatureincreases the gap (a+link). - An increase in the
Temperature Gapcauses an increase inFurnace Activity(a+link). The bigger the gap, the harder the furnace works. - An increase in
Furnace Activitycauses an increase inCurrent Temperature(a+link).
- The
- Identify the Loop: Let's trace the main regulatory cycle:
Current Temperature→Temperature Gap→Furnace Activity→Current Temperature. This loop contains exactly one negative link (fromCurrent TemperaturetoTemperature Gap). An odd number of negative links means this is a Balancing (B) loop.
A balancing loop for a home thermostat. The system works to close the 'Temperature Gap' between the 'Desired Temperature' and the 'Current Temperature' by adjusting 'Furnace Activity'.
3. Guided Practice: A System with Both Loops
Most real-world systems contain multiple interacting loops. Let's build a model of a simple ecosystem: the classic deer population on the Kaibab Plateau. This example is well-covered in the "Systems Thinking" chapter we'll use for this exercise.
Chapter 2: Systems Thinking: a New Way to Tackle ...
This text will walk us through the process of building a CLD for a deer population, clearly showing how reinforcing and balancing forces interact.
First, read the section "The Causal Loop Diagram" to familiarize yourself with the basic variables: Deer Population, Deer Births per Year, and Deer Deaths per Year. Next, read the sections on Balancing Feedback and Reinforcing Feedback. These paragraphs will guide you in constructing the two primary loops: The reinforcing birth loop (R): More deer lead to more births, which lead to more deer. The balancing death loop (B): More deer lead to more deaths (due to starvation, etc.), which lead to fewer deer. Finally, review Figure 2.6 and read the associated text in the section "Reinforcing Feedback", which introduces predators into the system.
Now, let's put your understanding into practice.
Exercise:
Take a moment to work through "Exercise 2.3" presented in the text you just reviewed. Based on the diagram in Figure 2.6, try to:
- Assign polarities to the new loop involving
Predator Population. - Determine if this new loop (
Deer Population→Predator Population→Deer Deaths per Year→Deer Population) is balancing or reinforcing. - Think about the "story" this loop tells.
Self-Correction:
After you've thought it through, here is the solution:
- Polarities:
Deer Population→Predator Population: An increase in deer (food) leads to an increase in predators (+).Predator Population→Deer Deaths per Year: An increase in predators leads to an increase in deer deaths (+).Deer Deaths per Year→Deer Population: This link is already established as−.
- Loop Type: The loop
Deer Population→Predator Population→Deer Deaths per Year→Deer Populationhas one negative link. It is therefore a Balancing (B) loop. - Story: This loop represents natural population control. When the deer population grows, the predator population can also grow, which in turn increases deer deaths, thus controlling the deer population. It's a second, slower-acting balancing force in addition to starvation.
4. From Pen and Paper to Software
Given your background in computer science, you'll appreciate that CLD construction is not limited to whiteboards. Specialized software tools exist to create, analyze, and (in more advanced applications) simulate these models. Vensim is one such tool.
You don't need to use the software now, but watching how a diagram is constructed in a digital environment can help solidify the concepts.
Vensim Causal Loop Diagramming
This tutorial from the makers of Vensim shows the digital workflow for creating the very population model we've been discussing.
Watch the following segments to see the process in action: Adding variables and links to create the basic structure. Assigning link polarities to define the causal relationships. Labeling the loops as reinforcing (R) and balancing (B).
Notice how the process in the software exactly mirrors the intellectual steps we've been practicing: defining elements, connecting them causally, and identifying the resulting feedback dynamics.
Conclusion
In this lesson, you moved from being a reader to a writer of Causal Loop Diagrams. You have practiced the fundamental skill of translating a system's description into a formal feedback structure.
Here are the key takeaways from our practice:
- CLD construction is a step-by-step process: Start by identifying variables, then link them with causal arrows and polarities, and finally identify the resulting loops.
- Reinforcing loops are composed of an even number (or zero) of negative links and drive runaway growth or collapse.
- Balancing loops are composed of an odd number of negative links and are goal-seeking. Making the goal and the "gap" explicit is key to building clear balancing loop diagrams.
- Simple systems can be built by combining these fundamental loop types.
You are now equipped to map the structure of simple systems. In our next lesson, we will explore the consequences of these structures. We will delve deeper into the behavior that feedback creates, addressing the learning outcome: Explain the concept of stability in a feedback system and the trade-off between responsiveness and stability.