Introduction
Welcome to the third lesson of our capstone project on building a Recruitment Pipeline Report. In the previous lesson, you did some excellent work enhancing the MasterTracker. You transformed it from a simple data list into an analytical tool by adding calculated columns for Days in Pipeline, Status, and Time to Decision, along with several "counter" columns.
Today, we will use that enhanced data to achieve our next learning outcome: to build a PivotTable summary showing candidate counts by pipeline stage and recruiter.
A PivotTable is one of the most powerful tools in Excel for an MIS Executive. It allows you to take thousands of rows of data and create a concise, structured summary report in seconds—without writing a single formula. We will turn your flat table of candidate data into a dynamic summary that provides immediate insights into your recruitment funnel.
1. Creating Your First PivotTable
Before you can analyze your data, you need to summarize it. A PivotTable is the perfect tool for this. The first step is to insert one based on your MasterTracker table.
Because you have already structured your data as an Excel Table, you're perfectly set up. Excel will automatically recognize the entire data range and know that any new data you add later should be included when the PivotTable is refreshed.
To get a foundational understanding of how PivotTables work, let's start with a comprehensive video guide.
Pivot Table Excel | Step-by-Step Tutorial
Watch this tutorial from Kevin Stratvert. It provides a clear, step-by-step walkthrough of creating a PivotTable, from preparing the data to building the report. It's an excellent primer for what we're about to do.
Watch the first 3 minutes and 39 seconds of the video (from 00:10 to 03:39). Pay close attention to: How he inserts the PivotTable from an existing table. The 'PivotTable Fields' pane that appears on the right. How he drags fields into the 'Rows' and 'Values' areas to start building the report.
Your Turn: Insert a PivotTable
- Open the
MasterTrackerExcel file that you enhanced in the last lesson. - Click any single cell inside your
MasterTrackertable. - Go to the Insert tab on the ribbon and click PivotTable.
- A dialog box will appear. The
Table/Rangeshould already show your table name (e.g.,MasterTracker). - Ensure New Worksheet is selected. This keeps your summary report separate from your raw data, which is a best practice.
- Click OK.
You will now see a new worksheet with a PivotTable placeholder on the left and the PivotTable Fields pane on the right. This pane is your control panel for designing the report.
2. Building the Summary: Counts by Stage and Recruiter
Our goal is to create a report that shows two things simultaneously: how many candidates are in each stage, and which recruiter is managing them. This requires a two-dimensional summary.
First, let's get a simple count of candidates for each Current Stage.
Activity: Count Candidates by Stage
- In the PivotTable Fields pane, find the
Current Stagefield. Drag it into the Rows area at the bottom of the pane. You'll see the stages (Screening, Interview, Offer, etc.) appear as row labels in your PivotTable. - Next, we need to count the candidates. A common and reliable method is to use a unique identifier. Drag the
Candidate IDfield into the Values area. - Crucially, Excel might default to
Sum of Candidate ID. This doesn't make sense; we need to count the candidates, not sum their IDs.- Click on
Sum of Candidate IDin the Values area. - Select Value Field Settings.
- In the dialog box, change the calculation from
Sumto Count. - Click OK.
- Click on
Your PivotTable now shows a count of candidates in each recruitment stage.
Activity: Add the Recruiter Dimension
Now, let's add the Recruiter breakdown.
- Find the
Recruiterfield in your field list. - Drag the
Recruiterfield into the Columns area.
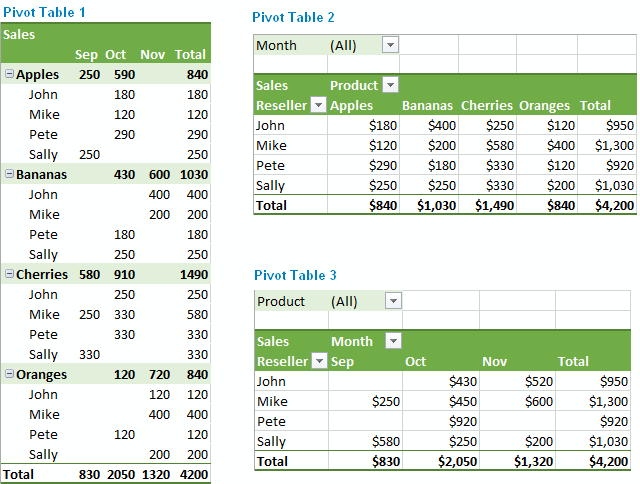
Instantly, your PivotTable transforms into a matrix. You now have Current Stage running down the rows, Recruiter names across the columns, and the count of candidates at the intersection of each. This is a classic MIS report format that provides a huge amount of information at a glance.

3. Alternative Method: Using Your Counter Columns
In the last lesson, you created helper columns like Hired Counter, Rejected Counter, and Active Counter. This was strategic preparation for this exact moment. Using these columns can make summarizing even faster.
Let's see how. We will create a simple summary of Hired, Rejected, and Active candidates by recruiter.
Activity: Summarize with Counter Columns
- Clear your existing PivotTable by dragging all the fields out of the four areas (Rows, Columns, Values, Filter).
- Drag
Recruiterto the Rows area. - Now, drag
Active Counter,Hired Counter, andRejected Counterone by one into the Values area.
Notice that Excel defaults to Sum for each of these. In this case, that's exactly what we want! Since the columns contain a 1 for the correct status and 0 otherwise, summing them up gives a perfect count. This method is explicit and removes the step of changing the value field setting.
This technique is especially useful when you want to show specific, pre-defined categories as columns in your final report, as we've done here.
4. Finalizing Your Report
A raw PivotTable is functional, but for an MIS report, presentation matters. Let's apply a few professional touches.
Excel For HR: How to Use Pivot Tables [2025]
The context in this HR-focused video is very relevant. It demonstrates how to build a PivotTable for headcount and then break it down by another dimension (gender), which is very similar to our candidate/recruiter analysis.
Watch the segment from 01:06 to 04:30. It reinforces the core concepts we've just practiced: Using an ID field and changing the calculation to Count (02:25). Adding a second dimension to the 'Columns' area to create a breakdown (03:30).
Your Turn: Polish the PivotTable
Let's return to your main PivotTable (with Current Stage in Rows and Recruiter in Columns).
- Clean up Empty Cells: You may see
(blank)values. It’s cleaner to show these as0.- Right-click anywhere in the PivotTable.
- Choose PivotTable Options.
- On the Layout & Format tab, check the box for For empty cells show: and type
0. Click OK.
- Rename Headers: The default headers like "Row Labels" and "Column Labels" are unprofessional.
- Simply click on the cell that says "Row Labels" and type a better title, like Pipeline Stage.
- Do the same for "Column Labels" and rename it to Recruiter.
- Apply a Style:
- Click anywhere in your PivotTable.
- Go to the Design tab that appears.
- Explore the PivotTable Styles gallery and pick a clean, professional-looking style. This simple step greatly improves readability.
- Refresh Data: This is a crucial final point. If you go back to your
MasterTrackerand add or change any data, the PivotTable will not update automatically. You must manually refresh it.- Right-click the PivotTable and select Refresh. (Alternatively, go to the Data tab and click Refresh All).
Conclusion
Excellent work! You have successfully transformed a detailed data tracker into a powerful, interactive summary report. This is a fundamental skill for any MIS role, allowing you to quickly answer key business questions directly from source data.
Here are your key takeaways from this lesson:
- A PivotTable is the fastest way to summarize large datasets in Excel.
- You build reports by dragging fields into the Rows, Columns, and Values areas.
- When counting items like candidates, you must change the Value Field Settings from the default
SumtoCount. - You can create powerful two-dimensional summaries by using both the
RowsandColumnsareas. - Using pre-calculated helper columns (like your
Hired Counter) can simplify and speed up PivotTable creation. - Always format and refresh your PivotTable to ensure it is clean, professional, and up-to-date.
Your MasterTracker is now feeding a powerful summary report. In our next lesson, we will bring this data to life by creating visualizations. You will learn how to create a dashboard to visualize recruitment funnel metrics and recruiter performance, turning your summary table into an insightful and interactive tool for management.