Hello! Welcome to your next lesson on mastering Excel for your MIS Executive career.
In our last session, we covered how to use Named Ranges for static values, making formulas like =Total_Sales*Commission_Rate clear and easy to maintain. This is great for fixed data points. Today, we shift our focus back to the dynamic, row-based data you've structured in Excel Tables.
This lesson addresses the learning outcome: Sort and filter data within an Excel Table using single and multi-level criteria. This is a fundamental skill for any data professional. In your previous roles, whether identifying sensitive information in cybersecurity incidents or shortlisting candidates in recruitment, you were constantly organizing and drilling down into data. Today, you'll learn how to do this efficiently in Excel.
We will cover:
- Sorting data by one or more columns to bring order to your information.
- Filtering data to hide what's irrelevant and focus only on the records that matter.
- Using Slicers as a visual, user-friendly tool to interact with your data.
1. Sorting Data in an Excel Table
When you convert a range to an Excel Table, one of the first things you'll notice is the small dropdown arrow that appears in each header cell. These arrows are your gateway to sorting and filtering.
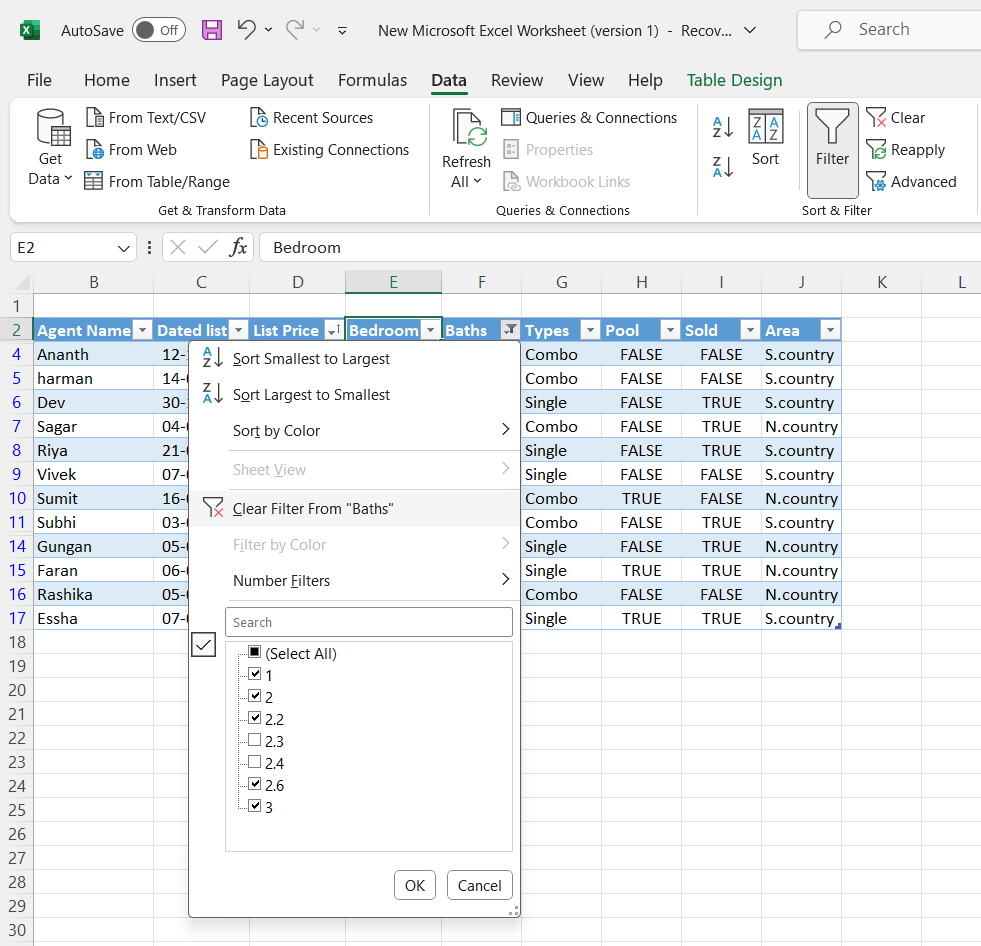
Basic and Multi-Level Sorting
The simplest way to organize your data is to sort it by a single column (e.g., alphabetically by name, or chronologically by date). However, the real power comes from multi-level sorting, where you can define a hierarchy. For instance, you might want to see your data sorted first by Department, and then within each department, sorted by Salary from highest to lowest.
This is a common task in MIS reporting to identify top performers or prioritize tasks by group.
To see how this works in practice, please watch the following video. It covers everything from basic sorting to the more powerful multi-level and custom sorting methods.
Section 6: Master Sorting, Filters, Tables & Advanced Excel Techniques | Excel Tips & Tricks
This video from Pavan Lalwani will guide you through the different ways to sort data in Excel. Pay close attention to the distinction between single-level and multi-level sorting.
Please watch the following two segments: Basic Sorting (00:00 - 04:27): This covers the fundamentals of sorting text, numbers, and dates in ascending or descending order. Multi-Layer Sorting (04:27 - 06:58): This segment demonstrates how to use the 'Sort' dialog box to apply multiple levels of sorting criteria, which is essential for structured analysis.
The multi-level sort dialog box is your primary tool for this. It allows you to add layers of logic to your data organization.

Advanced Sorting: By Color and Custom Lists
Sometimes, alphabetical or numerical order isn't what you need.
- Sort by Color: If you use cell colors to indicate status (e.g., green for 'Complete', yellow for 'In Progress', red for 'Overdue'), you can sort by these colors to group all similar-status items together.
- Custom Lists: Excel defaults to sorting text alphabetically (April, August, December...). A custom list allows you to define a logical order (January, February, March...) and sort accordingly. This is perfect for reports based on months, business quarters, or priority levels (High, Medium, Low).
Section 6: Master Sorting, Filters, Tables & Advanced Excel Techniques | Excel Tips & Tricks
Let's continue with the same video to see how these advanced sorting methods work.
Please watch these next two segments: Sorting by Color (06:58 - 09:59): Learn how to bring rows with specific cell or font colors to the top of your list. Custom Sorting (09:59 - 11:44): See how to sort data based on a non-alphabetical custom list, like the months of the year.
2. Filtering Data to Isolate Information
While sorting organizes all your data, filtering temporarily hides the data you don't want to see. This is incredibly useful for focusing on a specific subset of your dataset without deleting anything. For an MIS report, you might filter to show only the sales for the "North" region or incidents assigned to a specific analyst.
You can apply filters to multiple columns at once. For example, you can filter for:
Region = "North"- AND
Product = "Laptops" - AND
Sale DateisThis Quarter
Text, Number, and Date Filters
Excel provides specific filtering options depending on the type of data in the column. Date filters are especially powerful, with built-in options like "Last Month," "This Year," or "Next Quarter," which are invaluable for creating timely reports.
Section 6: Master Sorting, Filters, Tables & Advanced Excel Techniques | Excel Tips & Tricks
This comprehensive segment from the Pavan Lalwani video covers the essentials of filtering, including the different conditions you can apply to text, number, and date columns.
Please watch from 11:44 to 24:22. Focus on understanding the different types of filters available: Number Filters: Greater Than, Top 10, Above Average Text Filters: Begins With, Contains (including wildcard characters like *) Date Filters: This Month, Last Quarter, Between... Filter by Color: Similar to sorting by color, you can show only the rows of a certain color.
3. Visual Filtering with Slicers
While the filter dropdowns are powerful, they aren't always the most user-friendly, especially for others who might use your report. Slicers are clickable buttons that perform filtering actions. They are a core feature of Excel Tables and are essential for building the interactive dashboards you'll be creating later in this course.
Excel table: comprehensive tutorial with examples
First, let's quickly read about what slicers are and how to insert them. This article from Ablebits.com provides a concise overview.
Please read the section titled 'Insert a slicer to filter table data in the visual way'. This will give you a quick, step-by-step guide.
Now, let's see slicers in action. They make filtering feel less like a technical task and more like interacting with a web page, which is great for presenting data.
Section 6: Master Sorting, Filters, Tables & Advanced Excel Techniques | Excel Tips & Tricks
This final clip from the Pavan Lalwani video demonstrates how to create and use slicers with an Excel Table. Notice how much faster and more intuitive it is to click buttons rather than navigating dropdown menus.
Watch the segment from 49:12 to 53:47 to see how slicers can be added, customized, and used to filter data dynamically.
4. Hands-On Practice
Now it's time to apply these skills. The following resource is a practical exercise. Please follow the instructions on the page to download the accompanying Excel file and perform the requested sorting and filtering tasks.
Sort and filter a table of data in Excel for hair salon data
This exercise from Wise Owl will test your ability to perform multi-level sorting and apply multiple filter criteria to a dataset. This is exactly the kind of task you'll perform in an MIS role.
Open the webpage and follow its instructions to get the starting Excel file. Complete the multi-level sort task as described (sort by Treatments, then by surname and initial). Complete the first filtering task (red hair, over 45, joined after June 1st, 2022). Complete the second filtering task (blonde hair, balayage treatment, new client in 2022). Compare your results with the screenshots provided in the exercise to check your work.
Key Takeaways
- Integrated Tools: Excel Tables have built-in sorting and filtering capabilities accessible from the header-row dropdowns.
- Multi-Level Sorting: Use the
Sortdialog box (Data > Sort) to organize your data by a primary field, then a secondary field, and so on. - Multi-Criteria Filtering: Apply filters across several columns to zero in on the specific data records that meet all your conditions.
- Slicers: Use Slicers for a fast, visual, and user-friendly way to filter your table data. They are a foundational element for building interactive reports and dashboards.
Next Lesson
Excellent work! You can now organize and drill down into large datasets using the powerful features built into Excel Tables.
In our next lesson, we will begin exploring Core Formulas for Conditional Logic. We'll start with the most important concept for writing scalable formulas: understanding absolute, relative, and mixed cell references ($A$1, A1, $A1, A$1). This knowledge is the key to writing a single formula that you can correctly copy across thousands of rows and columns.