Introduction
Welcome to our final lesson in the Power Query module! In the previous lessons, you've learned the "Extract" part of the data workflow by getting data from various sources, and the "Transform" part by cleaning and shaping that data in the Power Query Editor. Today, we'll complete the process by focusing on the "Load" step.
This is a critical final stage. After you've perfectly cleaned your data, you need to decide where it should go. Do you want it in a visible table on a worksheet? Or should it be a hidden connection that feeds a PivotTable or a chart? Your choice here impacts your report's efficiency, file size, and ease of use.
Our goal for this lesson is to master how to load the cleaned and transformed data into the Excel data model or a new worksheet table. Understanding these options is the last core skill you need before we move on to building full-scale MIS reports in our capstone projects.
1. Close & Load: Choosing Your Destination
In the Power Query Editor, the Home tab has two crucial buttons for finishing your work:
- Close & Load: This is the default, one-click option. It loads your query's output into a new worksheet as an Excel Table.
- Close & Load To...: This is the more powerful option. It opens a dialog box that gives you precise control over where and how your data is loaded.
For professional MIS work, you will almost always use Close & Load To... to ensure your data is handled in the most efficient way for your specific report.
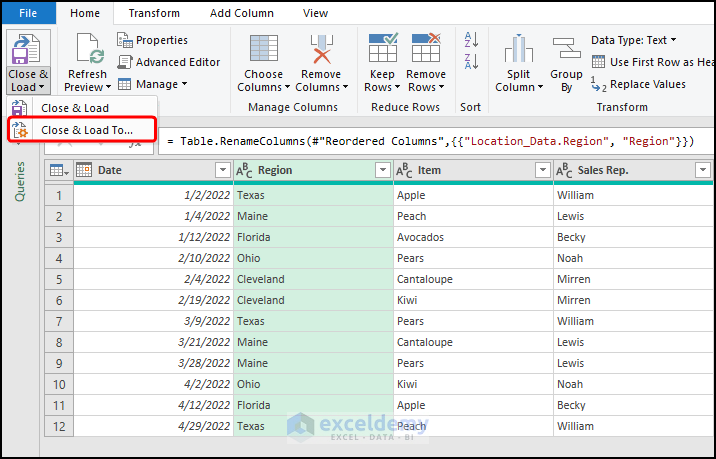
2. The Import Data Dialog: Your Three Key Choices
When you select Close & Load To..., you'll see the Import Data dialog box. This box asks you to make three important decisions. Let's explore them.
Get to know Power Query Close & Load options
This article from Excel Off The Grid provides an excellent breakdown of the Import Data window. We will use its structure to understand our options.
Read the first four sections of the article: Close & Load settings: This introduces the dialog box. How to view the query output: Pay close attention to the difference between Table and Only Create Connection. Where to put the query output: Understand the New worksheet vs. Existing worksheet options. Add to the Data Model: Read this section to get a high-level idea of what the Data Model is and its key benefit for file size.
Let's summarize the most important destinations for an MIS report:
a) Loading as a Table
This is the most straightforward option. It places your query output directly onto a worksheet as a standard, green Excel Table.
- When to use it: When you need to see the raw, cleaned data in your workbook, or when other formulas on a worksheet need to refer directly to this output table.
b) Loading as a Connection Only
This is a powerful concept. When you choose "Only Create Connection", the query exists in the "Queries & Connections" pane, it can be refreshed, and it can be used by other parts of Excel, but the data itself is not loaded onto a worksheet.
- When to use it:
- For "helper" or "staging" queries that are used as inputs for another query (like when you merge two files before doing final calculations).
- Crucially, when your final goal is to create a PivotTable or PivotChart. Loading the data as a connection first and then building the PivotTable from that connection is the most efficient workflow.
This video brilliantly explains why this is so important and demonstrates a common problem you can avoid.
Power Query Basic 02 - Close and Load... To table or connection? That's the question
This video from wmfexcel highlights a critical issue: the 'double refresh' problem that happens when a PivotTable is based on a Power Query output table. It then shows how using 'Connection Only' solves it.
Watch from 02:06 to 07:08. First, you'll see the problem: when the source data changes, you have to refresh twice to update the PivotTable (once for the Power Query table, and again for the PivotTable). Then, you'll see the solution: by loading the query as a connection only and building the PivotTable from that connection, a single refresh updates everything.
c) Loading to the Data Model
The Data Model is a highly compressed, behind-the-scenes database inside your Excel file. By checking the "Add this data to the Data Model" box, you send your query output there.
- When to use it:
- When dealing with very large datasets (hundreds of thousands or millions of rows). The Data Model is far more efficient than a worksheet and keeps your file size much smaller.
- When you need to create relationships between multiple tables (an advanced topic we won't cover in detail now).
The most common professional workflow for large reports is to combine "Only Create Connection" with "Add this data to the Data Model". This keeps your data off the worksheet grid but makes it available in its most efficient form for creating PivotTables.
This next video shows the simple mechanics of loading data to the Data Model.
Power Query and the Secrets of the LOAD To Option
This segment from Mike Thomas demonstrates how to load data directly into the Data Model without putting it on a worksheet first.
Watch from 02:16 to 04:05. Notice how he selects 'Only Create Connection' and 'Add this data to the Data Model' to achieve this. He then shows you how to view the data inside the Data Model window.
3. Your Turn: Loading the Master Incident Log
Let's apply these concepts to the Master Incident Log.xlsx file from our previous lesson.
- Open your
Master Incident Log.xlsxfile. In the "Queries & Connections" pane on the right, you should see yourMaster_Logquery. - Right-click on the
Master_Logquery and select Load To.... This will open theImport Datadialog.
Scenario 1: Load as a Final Table
Imagine your manager wants to see the final, clean list of all incidents.
- In the
Import Datadialog, select Table. - Select New worksheet.
- Ensure "Add this data to the Data Model" is unchecked.
- Click OK.
Excel will create a new worksheet and load your clean data into a table. This is the simplest load destination.
Scenario 2: Load as a Connection for a PivotTable
Now, imagine your goal is to create a summary PivotTable showing incident counts by priority.
- First, change the load setting. Right-click the
Master_Logquery again and select Load To.... - This time, select Only Create Connection. Click OK.
- You will get a warning that the table on your worksheet will be deleted. This is expected. Click OK. Your worksheet with the table will be gone, but the query is still active in the "Queries & Connections" pane.
- Now, create the PivotTable. Go to an empty worksheet, click the Insert tab, and select PivotTable > From External Data Source.
- In the
PivotTable from External Data Sourcedialog, click the Choose Connection... button. - In the
Existing Connectionswindow, make sure you are on the Queries tab. You should seeMaster_Log. Select it and click Open. - Click OK.
You now have a new PivotTable ready to go. You can drag Priority to the Rows area and Incident ID to the Values area (make sure it's set to Count) to create your summary. Because you built this from the connection, you will never have the "double refresh" problem. This is the workflow you will use for your capstone projects.
Conclusion
You have now completed the entire ETL (Extract, Transform, Load) cycle in Power Query! This is a massive step toward becoming a proficient MIS professional.
Key Takeaways:
- Always use
Close & Load To...to control where your data goes. - Load as a Table when you need to see the data on a worksheet.
- Load as Only Create Connection when your query is an intermediate step or when you plan to build a PivotTable or PivotChart from it.
- Check Add this data to the Data Model, usually in combination with "Only Create Connection", to handle large datasets efficiently and keep file sizes small.
You are now fully equipped with the Power Query skills needed for our next phase. In the upcoming lessons, we will begin our first capstone project: building a complete Incident Management MIS System. You will use everything you've learned—getting data, transforming it, and loading it—to construct a real-world report from start to finish.