Introduction
Welcome back! In our last two lessons, you mastered bringing data into Power Query, whether it was from multiple files in a folder or multiple worksheets in a single workbook. This is the "Get Data" or "Extract" part of the data workflow.
Today, we dive into the heart of Power Query: the "Transform" stage. Raw data from systems is rarely perfect. It often contains extra columns, irrelevant rows, inconsistent formatting, and incorrect data types. As an MIS Executive, your ability to efficiently clean and reshape this data is a critical skill.
Our learning outcome for this lesson is to apply basic data transformations in the Power Query Editor, specifically focusing on the most common and essential tasks: filtering rows, removing columns, and changing data types. Mastering these will allow you to build robust, automated data cleaning routines that you can apply to any report you create.
1. The Power Query Editor: Your Data Transformation Workshop
Whenever you get data in Excel using the "Get & Transform Data" tools, you are brought into the Power Query Editor. This is a separate window from Excel where all the cleaning and shaping happens.
Let's get familiar with its main components.
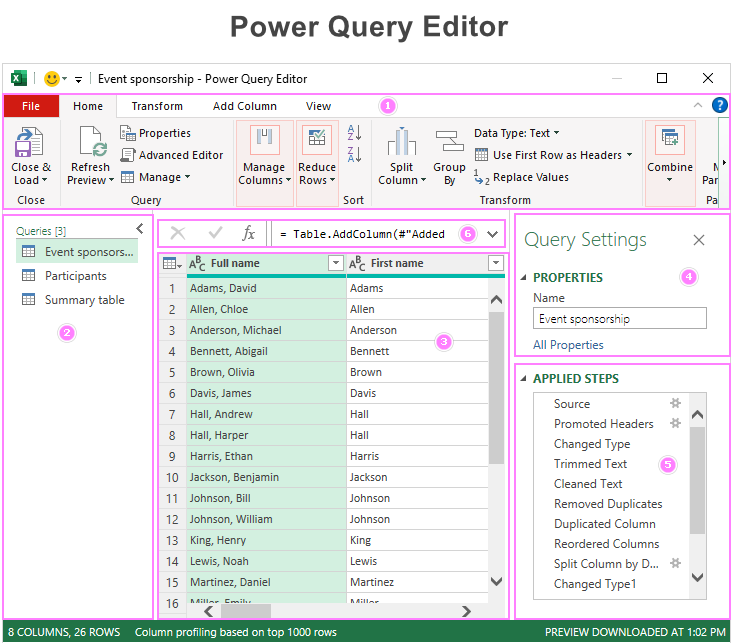
The key areas to know are:
- Ribbon: Contains all the transformation commands, organized into tabs like
Home,Transform, andAdd Column. - Data Preview: Shows a sample of your data so you can see the effect of your transformations in real-time.
- Query Settings: Here you can rename your query.
- Applied Steps: This is the most important part. Every action you take—removing a column, filtering a row, changing a format—is recorded here as a named step. This creates a repeatable sequence that will be automatically applied every time you refresh your data. It's like a macro, but much more powerful and easier to manage.
To get a quick video tour of this interface, you can review the introduction in this resource.
How to use Microsoft Power Query
This short segment from Kevin Stratvert's guide to Power Query provides a great orientation to the editor's layout and purpose.
Watch the clip from 05:22 to 07:03. The main takeaway is to understand how the 'Applied Steps' on the right side of the screen keep a running history of all your data cleaning actions.
2. Core Transformations: The Building Blocks of Clean Data
Let's break down the three fundamental transformations you'll use constantly.
a) Removing and Choosing Columns
Often, source data contains columns you don't need for your report (e.g., system IDs, timestamps). Removing them makes your dataset lighter and easier to work with.
You have two main ways to do this, and the choice has important implications:
- Remove Columns: You select the columns you don't want and remove them. If a new column is added to the source data later, it will be included in your query upon refresh because you never told Power Query to remove it.
- Remove Other Columns (or Choose Columns): You select the columns you want to keep and remove everything else. If a new column is added to the source data later, it will be excluded upon refresh, because you explicitly defined the exact columns to keep.
For MIS reporting, where you need a consistent structure, using Choose Columns or Remove Other Columns is generally safer and considered a best practice.
Common Power Query transformations - Excel Off The Grid
This article from Excel Off The Grid provides an excellent explanation of this concept.
Read the section titled "Manage Columns". Focus on the part that explains the difference between Remove Columns and Remove Other Columns. Understanding this will make your queries more robust.
b) Filtering Rows
Just as you remove unnecessary columns, you often need to remove unnecessary rows. This could include:
- Blank rows that appear in exports.
- Summary or total rows that you don't want in your raw data.
- Specific entries you need to exclude from your analysis (e.g., test data, cancelled orders).
You can filter rows using the dropdown arrow in any column header, similar to how you filter in a standard Excel table.
c) Changing Data Types
This is arguably the most critical transformation. When Power Query imports data, it tries to guess the data type for each column (Text, Whole Number, Decimal Number, Date, etc.), but it doesn't always get it right.
Why is this important?
- If a
Revenuecolumn is formatted as Text, you can't sum it. - If a
Datecolumn is formatted as Text, you can't group your data by month or year. - If a numeric
IDcolumn is formatted as a Number, Excel might try to sum it in a PivotTable instead of counting it.
You can change the data type by clicking the icon (e.g., ABC, 123, 📅) in the column header.
A special case: Using Locale
Your work experience in global firms means you might encounter data from different regions. A common issue is numbers formatted with a comma as the decimal separator (e.g., 1.234,56). If you try to change this to a number using standard settings, it will fail. The solution is to use the Using Locale option to tell Power Query the number's country of origin.
How To Import & Clean Messy Accounting Data in Excel | Use Power Query to Import SAP Data
This video from Leila Gharani brilliantly demonstrates how to solve this exact problem. It's an advanced tip that will be invaluable when working with international data.
Watch the section from 09:09 to 10:14. Notice how simply changing the type to 'Currency' fails, but using 'Change Type' > 'Using Locale' and selecting 'German (Germany)' correctly transforms the number.
3. Guided Walkthrough: Cleaning a Sales Dataset
Now, let's see these transformations in action. We'll return to the comprehensive video by Kevin Stratvert. You'll see him take a dataset and apply several of the transformations we've just discussed to clean it up for analysis.
How to use Microsoft Power Query
Follow along as Kevin Stratvert cleans a sample dataset. Pay close attention to the 'Applied Steps' pane on the right; you'll see a new step added for each action, building a repeatable cleaning process.
Please watch from 07:03 to 10:03, and then from 11:14 to 12:00. Here's a breakdown of what you'll see: Remove a Column (07:03 - 07:13): He removes the unneeded 'Source.Name' column. Filter Rows (07:13 - 07:54): He filters out promotional orders marked with 'XXXXXX'. Split and Rename Columns (07:54 - 08:49): He splits a combined 'Customer ID - Name' column into two separate columns and renames them. This is another very common and useful transformation. Change Data Types (09:45 - 10:03): He correctly sets the Revenue, Cost, and Profit columns to the 'Currency' data type. Understanding Applied Steps (11:14 - 12:00): This is a crucial part. He explains how each transformation is recorded and how you can undo or modify a step by interacting with the list.
4. Your Turn: Cleaning the Master Incident Log
It's time to apply these skills. Let's return to the Master Incident Log.xlsx file you created in the previous lesson. We'll imagine that the source data has become messy over time, and you need to clean it up.
1. Prepare the Messy Data:
- Open your
Master Incident Log.xlsxfile. - Go to one of your source sheets (e.g.,
Q1_Incidents). - Add an empty column at the end and name it
Verification Code. - Insert a blank row in the middle of your data.
- In the
Prioritycolumn, change "High" to "high" (lowercase). - Right-click on your
Master_Logquery in the "Queries & Connections" pane (usually on the right of your Excel window) and click Refresh. You should see the messy data (the new column, the blank row) appear in your final table.
2. Clean the Data in Power Query:
- Right-click the
Master_Logquery again, but this time click Edit. This will open the Power Query Editor. - Now, perform the following transformations. A new step will be added to your Applied Steps for each one.
- Remove the Column: Select the
Verification Codecolumn header, right-click, and choose Remove. - Filter the Rows: Click the filter arrow on any column's header (e.g.,
Incident ID), and uncheck (blank) from the list. This will remove any rows where that cell is blank. - Standardize Text: Select the
Prioritycolumn header. Go to the Transform tab in the ribbon, click Format, and then select Capitalize Each Word. This will fix "high" to "High", ensuring consistency. - Check Data Types: Ensure the
Date Reportedcolumn has a Date type (📅 icon) and theIncident IDcolumn has a Text type (ABC icon). If not, click the icon in the header and change them.
- Remove the Column: Select the
3. Load the Clean Data:
- Once you've applied all the steps, click the Close & Load button in the top-left of the Home tab.
- Your
Master_Logtable in Excel should now be clean again, without the blank row or extra column.
The beauty of this is that you've now built a cleaning robot. The next time you refresh your data, even if the source sheets are messy, Power Query will automatically repeat all these cleaning steps for you.
Conclusion
Excellent work! You've just learned the fundamental skills of data transformation in Power Query. This process of cleaning and structuring data is the backbone of reliable MIS reporting.
Key Takeaways:
- The Power Query Editor is your workshop for cleaning data, and the Applied Steps pane records every action you take.
- Removing columns and filtering rows are essential for focusing your dataset on only the relevant information.
- Setting the correct Data Type is critical for ensuring your calculations, sorting, and analytics work correctly.
- You can create an automated data-cleaning process that runs every time you hit Refresh.
In our next and final lesson for this module, we will explore the Close & Load options in more detail. Now that you know how to get and transform data, we'll look at the different ways you can load the final, clean data back into Excel for analysis and reporting.