Introduction
Welcome to your first capstone project! Over the next few lessons, we'll build a complete Incident Management MIS System from the ground up. This project is designed to mirror the kind of work you would do as an MIS Executive and directly leverages your background in incident response and data review.
In our previous modules, you mastered the fundamental building blocks of Excel: tables, formulas, data validation, and even Power Query. Now, it's time to put all those pieces together to create a practical, professional tool.
Today's lesson focuses on the first and most critical step: designing and building a complete incident tracking system using an Excel Table with data validation and conditional formatting. We will create the strong foundation upon which the entire MIS report will be built. This involves structuring our data correctly, ensuring data entry is consistent, and making the tracker easy to read at a glance.
Let's begin by designing the heart of our system.
1. Designing the Incident Tracker
Before writing a single formula, a good MIS professional thinks about the structure of their data. A well-designed tracker is the difference between a tool that provides clarity and one that creates confusion. Given your experience with PII/PHI and incident data, you already have an intuitive sense of what needs to be tracked.
The goal is to create a set of columns that captures all essential information for each incident, leaving no room for ambiguity.
How to Build Issue Trackers in Google Sheets & Excel
This article from Simular provides a great list of standard columns used in professional issue trackers. We'll use this as our starting point.
Read the section titled 'Step 2: Define Your Core Columns'. This will give you a solid, industry-standard list of fields to consider for our incident tracker.
Based on that and your own experience, a robust incident tracker typically includes fields like:
- Incident ID: A unique identifier for each incident.
- Date Reported: When the incident was logged.
- Description: A clear, concise summary of the incident.
- Category: The type of incident (e.g., Security, Technical, HR).
- Priority: The urgency (e.g., Critical, High, Medium, Low).
- Status: The current state (e.g., New, In Progress, Resolved).
- Owner: The person or team responsible for resolving it.
- Due Date: The target date for resolution.
- Date Resolved: The actual date the incident was closed.
This structure will form the basis of our system. While a simple list, when combined with Excel's features, it becomes a powerful tool.

2. Building the Tracker in Excel
Now, let's translate our design into a functional Excel tracker. We'll follow a systematic approach: first, we'll create a dedicated sheet for our dropdown lists, then build the main tracker table, and finally, link them using Data Validation.
This video provides an excellent, step-by-step guide for creating an issue log. We'll follow its methodology closely.
Create an Issue List in Excel | Issue Management for Project Management } Issue Log creation
This video from Project Management Mastery will guide us through the core construction of our tracker. We'll focus on creating the settings, columns, and data validation rules.
Please watch the following two sections: Creating the 'Settings' Tab (00:41 - 02:17): Pay attention to how a separate sheet is used to hold the lists for status, severity, and category. This is a best practice for keeping your workbook organized and easy to update. Creating the Issue Log Columns and Data Validation (02:17 - 07:44): Observe how the column headers are created and, more importantly, how the Data Validation tool is used to create dropdown menus that pull their options from the 'Settings' sheet.
To recap the key steps from the video:
- Create a
Settingssheet: This sheet acts as a central configuration area. For any column where you want a standardized list of options (likeStatusorPriority), you'll list those options here. This prevents typos and ensures everyone uses the same terminology. - Create an
Incident Logsheet: Add the column headers we designed in the previous step. - Apply Data Validation: For each column that needs a dropdown menu (e.g.,
Priority), select the column, go toData > Data Tools > Data Validation, chooseAllow: List, and for theSource, select the corresponding range from yourSettingssheet.
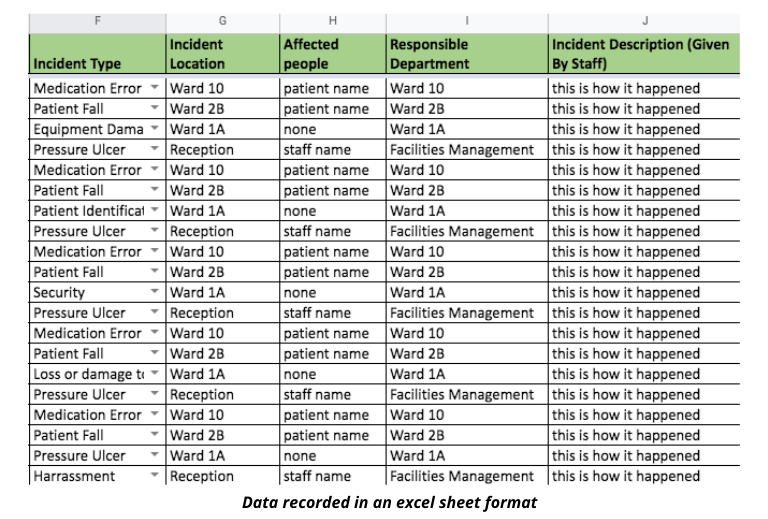
3. Using Conditional Formatting for Visual Alerts
A tracker with hundreds of rows can be hard to read. Conditional Formatting solves this by automatically highlighting rows based on rules you set. This allows anyone to spot critical issues or see the status of an incident instantly.
Create an Issue List in Excel | Issue Management for Project Management } Issue Log creation
Let's continue with the same video to see how to apply conditional formatting to make our tracker much more intuitive.
Watch from 07:44 to 13:33. The video demonstrates two powerful techniques: Highlighting rows based on severity: Notice how a formula is used in conditional formatting to check the value in the 'Severity' column and color the entire row accordingly. Graying out closed issues: A second rule is added to gray out and de-emphasize completed items. Pay close attention to the order of the rules in the 'Conditional Formatting Rules Manager'—the rule for closed issues must be on top.
The key takeaways are:
- You can use formulas within Conditional Formatting to apply formatting to an entire row based on the value of a single cell in that row.
- The order of conditional formatting rules matters. Excel applies them from top to bottom. By placing the "gray out if closed" rule first, you ensure it overrides any other color-coding once an incident is resolved.
4. Converting to an Excel Table
The final step in building our foundation is to convert the data range into a formal Excel Table. As you learned in Module 2, this is not just a matter of formatting; it transforms your data into a dynamic object.
Create an Issue List in Excel | Issue Management for Project Management } Issue Log creation
The final segment of the video shows how to convert the range to a table and briefly touches on one of its benefits.
Watch from 13:33 to 14:30. The key action here is using the shortcut Ctrl+T to format the data as a table. The video notes that when you add a new row, the table and its conditional formatting automatically expand. This is a crucial benefit for a growing log.
The primary benefits of using an Excel Table for our tracker are:
- Automatic Expansion: When you add a new incident in the row immediately below the table, the table automatically expands to include it, along with all formatting, data validation, and formulas.
- Easy Sorting and Filtering: The table headers automatically get filter dropdowns, making it simple to view, for example, only 'High' priority incidents.
- Structured References: (We will use this in the next lesson) Formulas that refer to table data are clearer and update automatically as the table grows or shrinks.
Your Turn: Build the Incident Tracker
Now it's time to build the tracker yourself. Please create a new Excel workbook and follow these steps.
-
Create a
SettingsSheet:- In one column, list the following Priorities:
Critical,High,Medium,Low. - In another column, list the following Statuses:
New,In Progress,Pending,Resolved. - In a third column, list the following Categories:
Cybersecurity,Data Privacy,HR,Facilities.
- In one column, list the following Priorities:
-
Create an
IncidentLogSheet:- Add the following headers in the first row:
IncidentID,DateReported,Category,Priority,Status,Description,Owner,TargetResolutionDate,DateResolved.
- Add the following headers in the first row:
-
Convert to an Excel Table:
- Select the header cells and use Ctrl+T. Ensure "My table has headers" is checked.
-
Apply Data Validation:
- Select the entire
Categorycolumn within the table. Apply data validation using the list of categories from yourSettingssheet. - Do the same for the
PriorityandStatuscolumns.
- Select the entire
-
Apply Conditional Formatting:
- Select all the data rows in your table.
- Create a rule that formats the entire row with a light red fill if the
PriorityisHigh. - Create another rule that formats the entire row with a dark red fill and white font if the
PriorityisCritical. - Create a final rule that formats the entire row with a gray fill and strikethrough font if the
StatusisResolved. - Go to
Conditional Formatting > Manage Rulesand ensure the "Resolved" rule is at the top of the list.
-
Add Sample Data:
- Enter 5-10 fictional incident records to test your tracker. Check that the dropdowns work and the conditional formatting updates automatically as you change
PriorityandStatus.
- Enter 5-10 fictional incident records to test your tracker. Check that the dropdowns work and the conditional formatting updates automatically as you change
Conclusion
Congratulations! You have successfully built the foundation of our Incident Management MIS. You've designed a logical structure, enforced data integrity with Data Validation, made the data visually intuitive with Conditional Formatting, and ensured it is scalable by using an Excel Table. This tracker is now a robust and reliable single source of truth for your incident data.
In our next lesson, we will make this tracker even more powerful. We'll write formulas directly within the table to auto-calculate key metrics like "incident age" and "resolution time," adding a layer of automated analysis to our system.