Hello! Welcome back to your course on engineering economics.
In our last few lessons, we've focused on the principles of decision-making inside a firm—concepts like opportunity cost, marginal analysis, and ignoring sunk costs. Now, we're going to shift our perspective outward to the marketplace where your products and services compete. Understanding the forces that govern this environment is essential for making sound strategic decisions.
Today's lesson addresses the learning outcome: Define the law of supply and the law of demand, and illustrate them using curves. This is the bedrock of microeconomics and the fundamental model for understanding how prices and sales volumes are determined in a competitive market. As someone who has scaled businesses, you've developed an intuition for pricing and customer behavior; this lesson will provide the formal economic framework for that experience.
The Law of Demand
Let's start with the customer's side of the market. In economics, "demand" isn't just the desire for a product; it's the quantity of a good or service that buyers are willing and able to purchase at various prices during a given period.
To formalize this, let's look at a concise definition.
This document from an MIT self-study course provides a clear, foundational definition of what economists mean by 'demand'.
Please read section 3.2, 'Demand' (starting on page 6 and ending just before section 3.3). Focus on the two components of demand—taste and ability to buy—and how they contribute to the relationship between price and quantity.
As the reading explains, this relationship is summarized by the Law of Demand:
Holding all other factors constant (ceteris paribus), as the price of a good increases, the quantity demanded for that good decreases. Conversely, as the price decreases, the quantity demanded increases.
This inverse relationship exists for a few key reasons:
- Substitution Effect: If your SaaS product becomes more expensive, potential customers will start looking for cheaper alternatives that solve the same problem.
- Income Effect: As the price of a good rises, a consumer's purchasing power decreases. They simply can't afford to buy as much as they could before.
- Diminishing Marginal Utility: The first unit of a product is often the most valuable. A company might desperately need one software license for a critical function, but the value of the 100th license is considerably lower. They are willing to pay less for additional units.
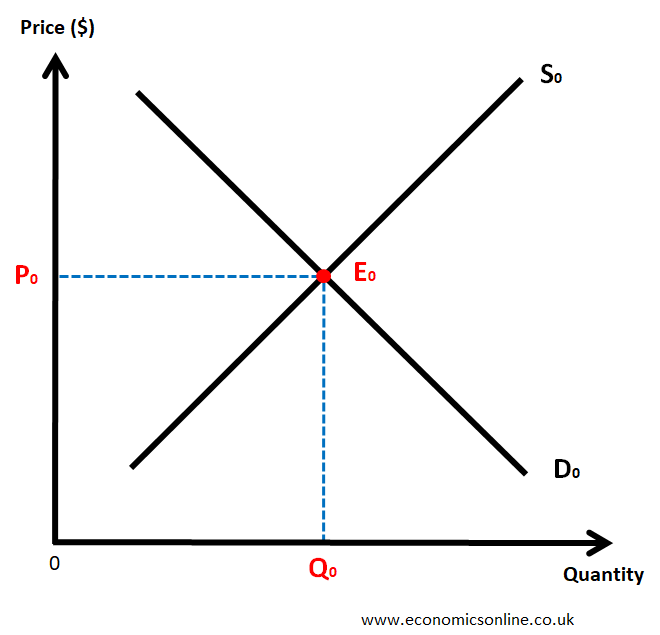
We visualize this relationship using a demand curve. In economics, the convention is to plot Price (P) on the vertical y-axis and Quantity (Q) on the horizontal x-axis. Because of the inverse relationship, the demand curve slopes downwards.
The Law of Supply
Now, let's turn to the producer's perspective. Supply refers to the quantity of a good or service that sellers are willing and able to offer for sale at various prices.
Using the same document, let's now examine the producer's side of the transaction.
Please read section 3.3, 'Supply' (on page 8). Pay attention to the reasoning behind why producers are willing to offer more of a product at a higher price.
This brings us to the Law of Supply:
Holding all other factors constant (ceteris paribus), as the price of a good increases, the quantity supplied of that good also increases. Conversely, as the price decreases, the quantity supplied decreases.
This direct relationship is driven by two main factors:
- The Profit Motive: A higher market price means greater potential revenue and profit. This incentivizes existing firms to produce more. For example, if the market rate for skilled Django developers goes up, more firms will be motivated to hire and train developers to sell those services.
- Increasing Marginal Costs: To quickly increase production, a firm often incurs higher costs per unit—think paying developers overtime to ship a feature faster or rushing a manufacturing process. A higher price is necessary to justify and cover these additional costs.
This relationship is graphed as a supply curve, which slopes upwards, showing that producers are willing to sell more units as the price rises.
The Supply and Demand Model
The power of this framework comes from putting both curves on the same graph. The interaction between buyers (demand) and sellers (supply) is what creates a market.
To bring this model to life, let's explore a classic explanation from a foundational MIT economics course.
MITOCW | 14.01-Lecture01-2023sep06.mp4
The following transcript from an MIT microeconomics lecture uses the famous 'diamond-water paradox' to intuitively explain why we need both supply and demand to understand price. It then applies the model to a concrete example.
Please read two key portions of the lecture transcript: Begin with the introduction to the supply and demand model, where the lecturer discusses Adam Smith's question about why diamonds are expensive and water is cheap (search for 'Adam Smith in 1776'). This highlights the importance of considering both sides of the market. Continue through the example of the 'market for roses.' This section explicitly defines the demand and supply curves and explains the logic behind their slopes, reinforcing what we've just covered.
As the lecture highlights, a good's price isn't determined by its usefulness (demand) alone, but by the interplay between that usefulness and its availability (supply). The point where the two curves intersect, labeled E0 on the graph, is called the market equilibrium. At this point, the price is such that the quantity consumers want to buy is exactly equal to the quantity producers want to sell.
Test your understanding!
A popular mobile game introduces a rare cosmetic "skin" for characters. Initially, the price is set quite high.
- According to the Law of Demand, what would you expect to happen to the quantity of skins sold per day if the game developers significantly lowered the price?
- According to the Law of Supply, what does the model suggest about the developers' incentive to create more of these rare skins if the market price for them were to increase dramatically?
Show answer
- The Law of Demand predicts that by lowering the price, the quantity of skins sold per day would increase significantly, as more players would be willing and able to purchase it.
- The Law of Supply suggests that if the market price for these skins were to rise dramatically, the developers would have a much stronger incentive to supply more of them. This could mean running more in-game events where the skin can be earned or simply making more available for direct purchase to capitalize on the high price.
Conclusion
In this lesson, we established the foundational model for analyzing a competitive market. You learned how the opposing interests of buyers and sellers are captured by the laws of supply and demand and visualized as curves.
- Key Takeaways:
- The Law of Demand: There is an inverse relationship between price and the quantity consumers are willing to buy. This is shown as a downward-sloping demand curve.
- The Law of Supply: There is a direct relationship between price and the quantity producers are willing to sell. This is shown as an upward-sloping supply curve.
- These laws operate under the assumption of ceteris paribus, meaning "all other things being equal."
- The graph of both curves together is the standard model for a competitive market.
Preview of the Next Lesson
We've established our static model by assuming "all other things are held constant." But in the real world, things are rarely constant. In our next lesson, we will explore what happens when this assumption is relaxed. We will identify the key factors that cause the entire demand and supply curves to shift and analyze how those shifts affect the market. We will also learn to calculate the equilibrium price and quantity where the market finds its balance.