Hello! Welcome back to our study of engineering economics.
In our last lesson, we built the foundational model of a competitive market: the supply and demand curves. We saw how a change in a product's own price causes a movement along these curves, based on the assumption that all other factors remain constant (ceteris paribus).
Today, we're going to break that assumption. The real world, especially the technology sector, is anything but constant. This lesson tackles the learning outcome: Identify the key determinants that cause shifts in supply and demand curves for technology products. We will explore the external factors that cause the entire demand or supply curve to move, leading to fundamental changes in the market. Understanding these "shifters" is the key to anticipating market dynamics, a critical skill for any technology leader.
Change in Demand vs. Change in Quantity Demanded
First, a crucial distinction.
- A change in quantity demanded is a movement along a fixed demand curve, caused only by a change in the product's own price. (e.g., you lower the price of your SaaS, more people subscribe).
- A change in demand is a shift of the entire demand curve to the left (a decrease in demand) or to the right (an increase in demand). This is caused by a change in something other than the product's price.
Let's identify these "other things," known as the determinants of demand.
The Determinants of Demand
For any product, including the software and hardware you develop, demand is influenced by several key factors. A change in any of these will shift the entire demand curve.

Here are the determinants with examples tailored to the technology sector:
-
Income of Buyers:
- Normal Goods: For most goods, as consumer income rises, the demand increases (shifts right). If the economy is strong and businesses have larger budgets, demand for premium enterprise software like Salesforce or advanced cloud computing tiers will increase.
- Inferior Goods: For some goods, as income rises, demand decreases (shifts left). A small business might rely on free, ad-supported project management tools. As their revenue grows, they might abandon these for a more powerful, paid alternative, decreasing demand for the "inferior" free tool.
-
Prices of Related Goods:
- Substitutes: These are products that can be used in place of each other. For example, Microsoft Azure and Amazon Web Services (AWS) are substitutes. If AWS significantly increases its prices, the demand for Azure will increase (shift right) as customers switch.
- Complements: These are products that are often used together. An example from your background is a Django web application and a PostgreSQL database. If the cost of deploying and managing PostgreSQL drops, it can make building Django apps more attractive, thus increasing the demand for Django developers and projects (shifting demand for Django services to the right).
-
Tastes and Preferences:
- Changes in consumer preferences can dramatically shift demand. A major security breach at a competitor's company could increase demand for your more secure software. Similarly, a shift towards remote work greatly increased the demand for collaboration tools like Slack and Zoom.
-
Number of Buyers:
- An increase in the number of potential customers shifts the demand curve to the right. When your company successfully enters a new international market or a new industry vertical, you are increasing the pool of potential buyers for your platform.
-
Expectations:
- Consumers' expectations about the future can change current demand. If Apple is expected to release a new iPhone in September, the demand for the current model will likely decrease in August (shift left) as people wait for the new version.
To see these concepts explained with more graphical examples, please review the following resource.
The Market Forces of Supply and Demand
These presentation slides from 'The Market Forces of Supply and Demand' provide a clear, visual breakdown of each determinant that shifts the demand curve. The examples are particularly relevant.
Please review the slides covering 'Demand Curve Shifters' (from slide 9 to 18). Focus on the examples provided for each determinant, such as laptops/desktops (substitutes) and computers/software (complements).
The Determinants of Supply
Just like the demand curve, the supply curve can also shift. A change in supply is a shift of the entire curve, caused by a factor other than the product's own price.
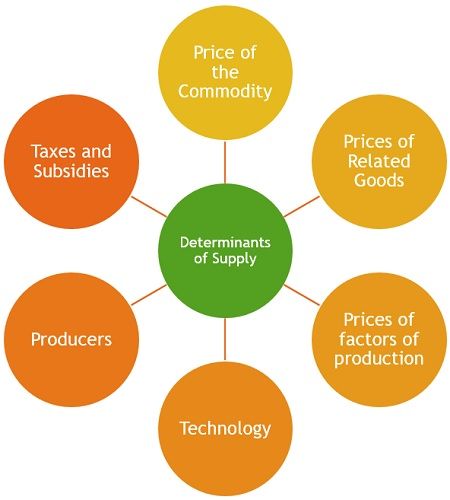
Here are the key determinants of supply for technology products:
-
Input Prices:
- This is a major factor in software and hardware. An increase in the average salary for senior Python developers (an input cost) will make it more expensive to produce software, decreasing the supply (shifting the curve left). Similarly, a rise in the cost of semiconductors will decrease the supply of the hardware that uses them.
-
Technology:
- This is a powerful driver in your field. An improvement in technology that lowers production costs increases supply (shifts the curve right). For instance, the development of Continuous Integration/Continuous Deployment (CI/CD) pipelines automated testing and deployment, making it faster and cheaper to supply new software updates.
-
Number of Sellers:
- An increase in the number of producers increases supply. The emergence of platforms like GitHub and app stores made it easier for independent developers to distribute their software, dramatically increasing the number of sellers and shifting the supply of software and apps to the right.
-
Expectations:
- Producers' expectations about future prices affect current supply. If a manufacturer of RAM chips expects prices to spike next quarter due to a new generation of video games, they might hold back some of their current inventory to sell later at a higher price. This would decrease the current supply (shift left).
The following part of the presentation you just reviewed covers these supply-side factors.
The Market Forces of Supply and Demand
Let's continue with the same presentation to see how the determinants of supply work.
Now, please review the slides on 'Supply Curve Shifters' (from slide 28 to 35). Pay close attention to the example of a cost-saving technological improvement, as this is highly relevant to engineering and software development.
Test your understanding!
Consider the market for a specialized data analytics software-as-a-service (SaaS) platform. For each scenario below, state whether it affects the demand or supply curve, which determinant is at play, and which way the curve shifts (left or right).
- A popular university begins teaching a course using your SaaS platform, training 1,000 new students on it each year.
- The primary cloud provider you use to host the platform announces a 30% price hike on server costs.
- A competing analytics platform is acquired by a large tech company and is now offered for free as part of a larger bundle.
Show answer
- Demand curve shifts right. The determinant is Tastes and Preferences (and arguably Number of Buyers, as you now have a trained user base entering the workforce). The training makes students prefer your platform, increasing its desirability among future employees and employers.
- Supply curve shifts left. The determinant is Input Prices. Your cost of production has increased, meaning at any given price, you are willing to supply less (or need to charge more for the same amount), effectively decreasing the supply.
- Demand curve shifts left. The determinant is the Price of a Related Good (Substitute). A strong substitute is now available at a much lower (zero) price, which will decrease the demand for your paid platform.
Application: A Technology Case Study
These determinants aren't just abstract concepts; they are the daily realities you've managed in your career. The following case study of a real company highlights how these forces create tangible business challenges.
Supply and Demand Analysis of a Hardware & Software ...
This case study details the challenges a cloud infrastructure company faced when expanding into the semiconductor hardware market. It's a perfect illustration of supply and demand determinants in the wild.
Please read the introduction and the first few sections of the case study (up to 'Our Solution'). As you read, try to connect the company's challenges to the determinants we've just discussed. For example, when it mentions 'limited raw material availability,' think about how that connects to input prices and the supply curve.
As you can see from the case study, the company struggled with:
- Demand-side shifts: "unprecedented demand for data center hardware" (a rapid shift in tastes/needs) and "inaccurate demand forecasting."
- Supply-side shifts: "limited raw material availability" and "skilled workforce shortages" (both are input price/availability issues), and "global supply chain uncertainties."
This shows how managing a technology business is, in economic terms, a constant exercise in responding to and anticipating shifts in both supply and demand.
Conclusion
Today we moved from a static view of the market to a dynamic one. You learned to identify the non-price factors that cause the supply and demand curves to shift, which is the engine of change in any market.
- Key Takeaways:
- A change in a product's price causes a movement along a curve. A change in a non-price determinant causes a shift of the entire curve.
- Demand is shifted by: changes in buyer income, prices of related goods (substitutes & complements), tastes, number of buyers, and expectations.
- Supply is shifted by: changes in input prices, technology, number of sellers, and expectations.
- These determinants are the underlying causes of the market fluctuations you've experienced in your business ventures.
Preview of the Next Lesson
Now that we know why the curves shift, the next logical question is: what is the result? In our next lesson, we will put everything together. We will learn how to determine the initial market equilibrium price and quantity, and then analyze how that equilibrium changes when a shift in either supply or demand occurs. This will equip you with a complete model to predict the impact of market events on price and sales volume.