Hello! Welcome back to our work on after-tax analysis.
In our last lesson, we focused on calculating the tax owed for a single year. We defined taxable income, determined the effective tax rate, and saw how taxes act as a direct cash outflow. You also saw how depreciation, while not a cash expense, creates a valuable "tax shield."
Today, we'll synthesize these concepts. We are moving from a single-year snapshot to a multi-year motion picture. Our goal is to calculate the complete, year-by-year after-tax cash flows (ATCF) for an entire investment project. This is the final and most critical data set we need before we can perform a realistic evaluation of a project's profitability.
1. The Anatomy of an After-Tax Cash Flow Calculation
To build an after-tax cash flow statement, we need to be precise with our terminology. Some figures are actual cash movements, while others are accounting constructs used to calculate taxes. Your experience with business P&L statements will be helpful here, as we are essentially formalizing that process for project evaluation.
Let's begin by defining the key components.
This presentation from METU OpenCourseWare provides clear, standard definitions for the terms we'll be using. It establishes the foundational formulas for our analysis.
Please read the slides that define 'Gross Income (GI)', 'Taxable Income (TI)', 'Cash Flow Before Taxes (CFBT)', and 'Cash Flow After Taxes (CFAT)'. The key is to understand the difference between cash flows (like CFBT and CFAT) and accounting figures (like TI).
Let's summarize the key relationships from the resource:
- Cash Flow Before Taxes (CFBT): This represents the actual cash generated by a project's operations before considering taxes.
- Taxable Income (TI): This is the accounting figure used to calculate tax liability. It is not a cash flow. It's the CFBT adjusted for the non-cash depreciation deduction.
- Taxes: This is the actual cash outflow paid to the government.
- Cash Flow After Taxes (CFAT or ATCF): This is the bottom line—the net cash flow remaining after taxes have been paid. This is the figure that truly matters for project evaluation.
2. The Tabular Method: A Step-by-Step Guide
The most straightforward way to calculate the ATCF for a project is to build a table, tracking each component year by year. This is exactly how you would model a project in a spreadsheet. The process follows the definitions we just established.
For each year of the project's life, you would set up columns for:
- Gross Income (GI)
- Operating Expenses (E)
- Depreciation (D)
- Taxable Income (TI = GI - E - D)
- Taxes (Taxes = TI × t)
- Cash Flow After Taxes (CFAT = (GI - E) - Taxes)
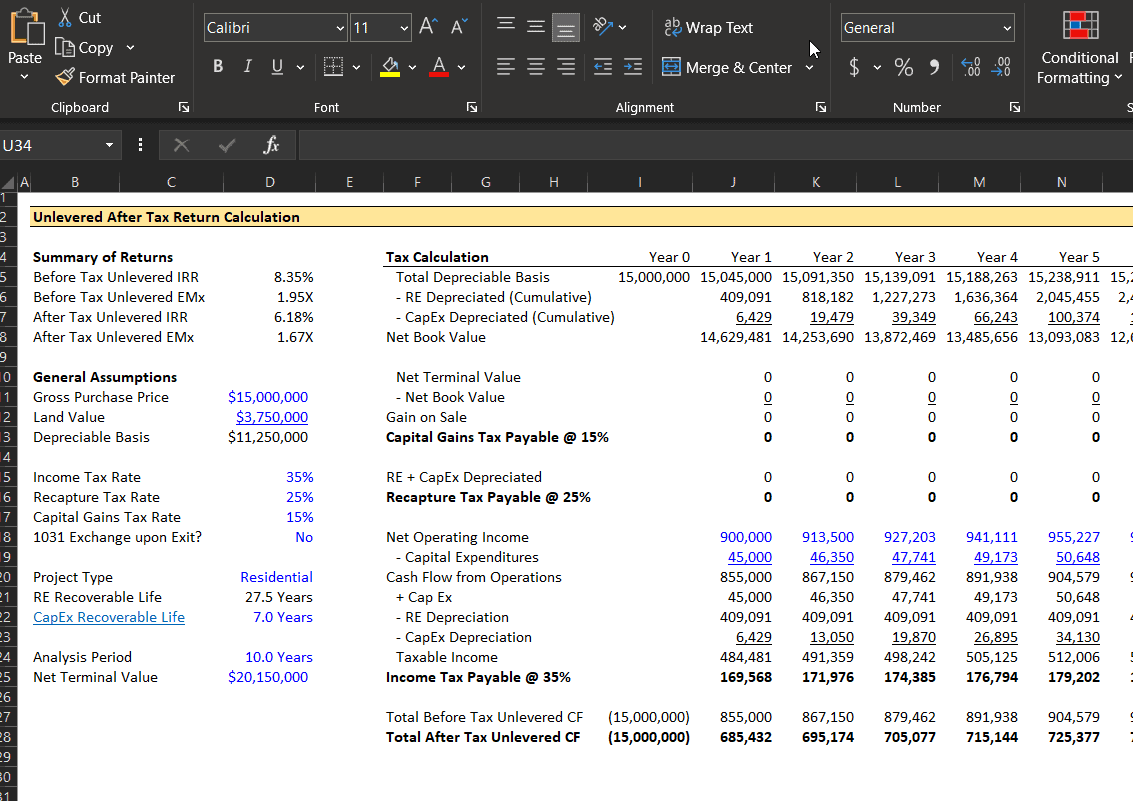
The image below shows a professional example of this structure in an Excel model. While it includes more complex details like recapture tax and capital gains (which we'll touch on later), the fundamental structure of columns for revenue, expenses, depreciation, taxable income, and taxes is the same.
3. Worked Example: A New Facility Project
Let's apply this tabular method to a concrete example. This exercise will walk us through calculating the ATCF stream for a new capital project from start to finish.
This resource provides a clear, step-by-step calculation for a 5-year project. We will use this as our case study to build a complete ATCF table.
Please review the 'In Class Work 20' example. Focus on the two tables: the first calculates Cash Flow Before Tax (CFBT) and the second calculates Cash Flow After Tax (CFAT). Trace how each number in the CFAT table is calculated based on the project data and the formulas we've discussed.
Let's break down the calculations from that example step-by-step.
Project Data:
- Initial Cost (P): $550,000
- Salvage Value (S): $150,000
- Recovery Period (n): 5 years
- Depreciation Method: Straight-Line
- Annual Gross Income (GI): $200,000
- Annual Operating Expenses (E): $90,000
- Tax Rate (t): 35%
Step 1: Calculate Annual Depreciation
Using the straight-line formula:
Step 2: Construct the ATCF Table
| Year | (A) GI | (B) E | (C) D | (D) TI (A-B-C) |
(E) Taxes (D × 0.35) |
(F) Initial Cost & Salvage | (G) ATCF (A-B-E+F) |
|---|---|---|---|---|---|---|---|
| 0 | - | - | - | - | - | -$550,000 | -$550,000 |
| 1 | $200k | $90k | $80k | $30k | $10,500 | - | $99,500 |
| 2 | $200k | $90k | $80k | $30k | $10,500 | - | $99,500 |
| 3 | $200k | $90k | $80k | $30k | $10,500 | - | $99,500 |
| 4 | $200k | $90k | $80k | $30k | $10,500 | - | $99,500 |
| 5 | $200k | $90k | $80k | $30k | $10,500 | +$150,000 | $249,500 |
- Year 0: The only cash flow is the initial investment (a cash outflow).
- Years 1-4: The ATCF is calculated as
GI - E - Taxes. So,$200k - $90k - $10.5k = $99.5k. - Year 5: The ATCF includes the operating cash flow plus the cash inflow from the salvage value.
$200k - $90k - $10.5k + $150k = $249.5k.
The final ATCF stream for this project is: {-$550k, $99.5k, $99.5k, $99.5k, $99.5k, $249.5k}. This is the data we'll use for evaluation.
4. An Alternative View: The "Add-Back" Method
Another common way to calculate ATCF, especially in finance and business management, is the "add-back" method. This method starts with the net profit and adds back the non-cash depreciation charge.
This is the approach outlined in the MIT Project Management resource (LINK).
- Calculate Net Profit After Taxes (NPAT), also known as Net Income.
- Add back the depreciation amount to get the ATCF.
Let's check this for Year 1 of our example:
NPAT = $30,000 × (1 - 0.35) = $30,000 × 0.65 = $19,500ATCF = $19,500 (NPAT) + $80,000 (D) = $99,500
This gives the exact same result. It's just a different way of arranging the same calculation, but it usefully separates the after-tax profit from the cash-flow effect of the non-cash depreciation charge.
Test your understanding!
You are evaluating the purchase of a new server for one of your SaaS platforms.
- The server costs $100,000.
- It will be depreciated using the straight-line method over 5 years to a salvage value of $0.
- It is expected to increase annual revenue by $60,000 and annual operating costs (power, maintenance) by $10,000.
- Your company's effective tax rate is 25%.
What is the After-Tax Cash Flow (ATCF) for Year 2 of this project?
Show answer
-
Calculate Annual Depreciation (D):
D = ($100,000 - $0) / 5 = $20,000per year. -
Calculate Cash Flow Before Taxes (CFBT):
CFBT = Gross Income Increase - Operating Cost IncreaseCFBT = $60,000 - $10,000 = $50,000 -
Calculate Taxable Income (TI):
TI = CFBT - D = $50,000 - $20,000 = $30,000 -
Calculate Taxes:
Taxes = TI × t = $30,000 × 0.25 = $7,500 -
Calculate After-Tax Cash Flow (ATCF):
ATCF = CFBT - Taxes = $50,000 - $7,500 = $42,500
The ATCF for Year 2 is $42,500.
Conclusion
Today we've assembled all the pieces of an after-tax analysis into a cohesive whole. By methodically stepping through each year of a project's life, we can construct the full after-tax cash flow stream, which is the most accurate representation of a project's financial impact.
- Key Takeaways:
- The calculation of After-Tax Cash Flow (ATCF) requires carefully distinguishing between actual cash flows (like revenue and operating expenses) and non-cash accounting items (like depreciation).
- The tabular method provides a clear, structured way to calculate the ATCF stream for a project's entire life:
ATCF = (Gross Income - Expenses) - (Taxable Income × tax rate). - An equivalent "add-back" method calculates ATCF as
(Net Profit After Tax) + Depreciation. - The final ATCF stream must account for the initial investment, operating years, and any terminal cash flows like salvage value.
Preview of the Next Lesson
We have successfully generated the complete ATCF stream for an investment project: {-$550k, $99.5k, $99.5k, $99.5k, $99.5k, $249.5k}. But what does this stream of numbers mean? Is this a good investment? In our next lesson, we will finally answer that question. We will learn how to evaluate projects on an after-tax basis using Net Present Worth analysis, bringing these future cash flows back to today's value to make a definitive decision.