Hello! Welcome back to our course on engineering economics.
In our last session, we mastered the process of constructing a project's complete, year-by-year after-tax cash flow (ATCF) stream. We now have the most accurate financial data for an investment, accounting for revenues, expenses, depreciation, and taxes.
Today, we take the final step. We will use that ATCF stream to make a definitive "go/no-go" decision. This lesson connects the accounting of taxes to the strategic act of evaluation. You will learn to evaluate projects on an after-tax basis using net present worth (NPW) analysis. This is a cornerstone skill for assessing the real-world financial viability of the technology projects and business investments you manage.
1. After-Tax Analysis: The Basic Principle
You'll recall from Module 4 that Present Worth analysis involves discounting all future cash flows to their value in Year 0 and summing them up. The core concept remains the same, but with two crucial adjustments for after-tax analysis:
- We use After-Tax Cash Flows (ATCF): The cash flows we discount must be the net amounts left after all taxes have been paid.
- We use an After-Tax MARR: The discount rate must also be on an after-tax basis. This ensures consistency. If you are discounting after-tax cash, you must use a rate that reflects an after-tax expectation of return.
The after-tax MARR is typically lower than the before-tax MARR. A simple approximation is:
For our purposes, the after-tax MARR will usually be provided. The key is to always pair after-tax cash flows with an after-tax discount rate.
The decision rule remains unchanged:
- For a single project: If NPW ≥ 0, the project is financially acceptable.
- For mutually exclusive alternatives: Choose the one with the highest positive NPW.
2. Applying NPW to an After-Tax Cash Flow Stream
Let's put this into practice using the ATCF stream we calculated in the previous lesson for the new facility project.
- Project ATCF Stream:
{-$550,000, $99,500, $99,500, $99,500, $99,500, $249,500} - Let's assume the company's after-tax MARR is 12%.
The Net Present Worth (NPW) is the sum of the present values of each cash flow:
For our project, the ATCF for years 1-4 is a uniform series (an annuity), which simplifies the calculation.
Let's find the values for the factors:
- is the term for the year 5 cash flow, which is
Now, plug them in:
Decision: Since the NPW is negative (-$106,223), the project does not meet the 12% after-tax MARR. It should be rejected. Even though the project generates positive cash flows, they are not large enough or soon enough to justify the initial investment at this required rate of return.
3. Comparing Alternatives using After-Tax NPW
A common task is choosing between two or more options. The process is the same: calculate the after-tax NPW for each and select the one with the highest value.
The following resource walks through an example comparing two construction plans, where the after-tax cash flows have already been determined.
This presentation from METU OpenCourseWare demonstrates how to compare two alternatives using after-tax analysis. The example provides the CFAT streams directly, allowing us to focus on the evaluation step.
Please review the section titled 'After-tax PW and AW', focusing on the example comparing 'Plan S' and 'Plan B'. Note how the Present Worth (PWS and PWB) is calculated for each alternative using their respective CFAT values and a given after-tax MARR of 7%.
As the resource shows:
- Plan S:
- Plan B:
Decision: Both plans are financially viable because their NPW is positive. Since they are mutually exclusive, we select the alternative with the higher NPW. Plan S is the better economic choice.
Test your understanding!
You are considering a new server for your company. After a full analysis, you've calculated the ATCF stream over its 4-year life: {-$60,000, $25,000, $25,000, $25,000, $25,000}. Your company's after-tax MARR is 15%.
Should you invest in the server? Calculate the NPW to justify your answer.
Show answer
First, we need to calculate the NPW of the project. The annual cash flows of $25,000 form a uniform series.
The value for the Present Worth factor is 2.8550.
Decision: Yes, you should invest. The NPW is $11,375, which is greater than 0. This means the project is expected to earn more than the 15% after-tax required return.
4. Practical Implementation: Using Spreadsheets
In your work, you'd almost certainly perform these calculations in a spreadsheet program like Excel or Google Sheets. The built-in NPV function is designed for this.
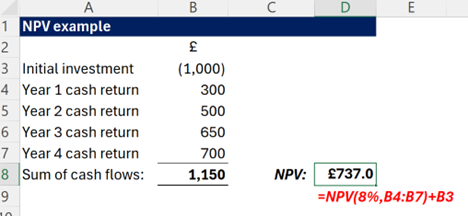
There is one critical detail to be aware of: The Excel NPV function assumes the first cash flow you give it occurs at the end of Year 1.
Therefore, the correct way to calculate NPW for a project with a Year 0 investment is:=NPV(rate, range_of_cash_flows_from_Year_1_onwards) + Year_0_cash_flow
For the example in the image, the formula is NPV(8%, B4:B7) + B3. This correctly calculates the present value of the returns from year 1 to 4 and then adds the initial investment from year 0 (which is already in present value). Mistaking this is a common error.
5. The Decisive Impact of Tax Policy
Why do we go through this extra effort of after-tax analysis? Because taxes and tax policy can completely change a project's outcome. A project that is unprofitable may become profitable with a tax incentive.
Let's see a powerful example of this.
ECONOMIC ANALYSIS AND LIFE CYCLE COSTING
The following resource demonstrates how a tax credit can make or break a project. It compares the NPV of a project with and without the credit.
First, review the section 'After Tax Cash Flows (ATCF)' to see the example of a waste heat recovery device with an initial cost of $100,000 and the resulting ATCF table. Then, read the section 'NPV OF WASTE HEAT RECOVERY DEVICE WITH AND WITHOUT TAX CREDIT'. Observe how the project's NPV is calculated first without any tax credits, and then recalculated after introducing a 30% tax credit.
Let's summarize the results from the resource (using an after-tax MARR of 20%):
- NPV without tax credit: The ATCF stream results in an NPV of -$17,759. The project is not acceptable.
- NPV with 30% tax credit: The tax credit directly reduces the initial cash outflow and slightly changes the annual depreciation. The new ATCF stream results in an NPV of +$9,999. The project is now acceptable.
This is a clear illustration of why after-tax analysis is not just an academic exercise. For a manager or entrepreneur, understanding how tax policies like credits, accelerated depreciation, or special deductions affect a project's NPW is essential for making sound investment decisions and capitalizing on available incentives.
Conclusion
Today, you have connected all the dots, from calculating depreciation and taxes to making a final, justifiable investment decision. By evaluating projects using after-tax NPW, you are assessing them based on their true financial impact on the company.
- Key Takeaways:
- After-tax project evaluation requires using both After-Tax Cash Flows (ATCF) and an After-Tax MARR.
- The Net Present Worth (NPW) is calculated by summing the present values of all ATCFs over the project's life.
- The decision rule is simple: accept projects with NPW ≥ 0 and, when comparing alternatives, choose the one with the highest NPW.
- Tax policies, like investment tax credits, can dramatically alter a project's NPW and change a "no-go" decision to a "go."
Preview of the Next Lesson
We've now established a robust method for calculating a project's value based on our best estimates. But what if those estimates are wrong? What if revenue is lower than expected, or operating costs are higher? Our next module tackles this head-on. We will begin by learning how to distinguish between risk and uncertainty, setting the stage to analyze how sensitive our project's success is to changes in our key assumptions.