Hello! Welcome back.
In our last lesson, we did the heavy lifting of performing a one-variable sensitivity analysis, generating tables of data that showed how a project's Present Worth changes when we adjust key inputs. While precise, those tables of numbers can be difficult to interpret at a glance, especially when you need to communicate your findings to stakeholders.
Today, we'll focus on turning that data into a clear, compelling visual story. Our goal is to interpret the results of a sensitivity analysis using a spider diagram to identify the most critical variables. This powerful visualization technique allows you to see the relative risk of all your project variables in a single snapshot, helping you focus your management attention where it matters most.
1. What is a Spider Diagram?
A spider diagram (also known as a sensitivity chart) is a graphical tool used to display the results of a sensitivity analysis. It plots the project's financial outcome—typically Net Present Value (NPV) or Present Worth (PW)—on the vertical axis against the percentage change of various input variables on the horizontal axis.
Each variable (like unit cost, demand, or initial investment) is represented by its own line. All the lines intersect at a single point, which represents the base case—the project's NPV when all variables are at their most likely, or forecast, values (i.e., at 0% deviation).
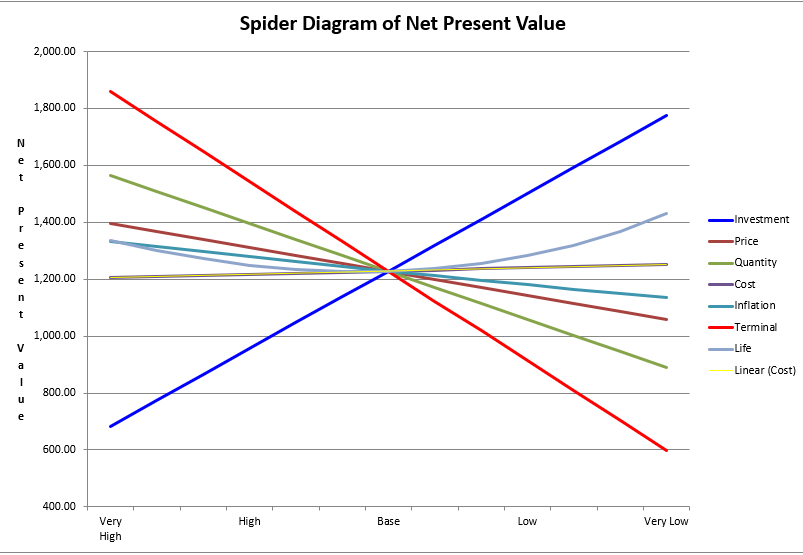
The main purpose of this diagram is to make the relative sensitivities of the variables immediately obvious. The key to interpreting it is simple:
The steeper the slope of a line, the more sensitive the project's outcome is to changes in that variable.
A steep line means that even a small change in that input variable will cause a large swing in the project's NPV, making it a critical factor to monitor. A flat line indicates that the NPV is not very responsive to changes in that variable.
2. Building and Interpreting the Diagram: A Worked Example
Let's walk through how to create and read a spider diagram using a concrete example. The process directly builds on the one-variable-at-a-time analysis we performed in the last lesson.
5.4 Evaluation of Risk – Engineering Economics
The following resource provides a clear example of how to display sensitivity analysis results. It shows how a data table is transformed into both a spider diagram (which it calls a 'sensitivity diagram') and a similar chart called a 'tornado diagram'.
Please read the sections titled 'Displaying Sensitivity Analysis Results' and 'Sensitivity Analysis: 1-year'. Focus on how the data table, which shows the calculated NPVs for ±20% variations in each variable, is used to plot the 'Sensitivity diagram'.
As you can see from the resource, the process is:
- Calculate the base case NPV. This is the central point of your diagram.
- For each variable, calculate the NPV at different percentage deviations (e.g., -20%, -10%, +10%, +20%) while keeping all other variables at their base case values. This generates the data points for each line.
- Plot these points on a graph to create the spider diagram.
Reading the Results
Now, let's interpret the 1-year spider diagram from the resource:
- Most Sensitive Variable: The line for Unit Price is by far the steepest. This tells us that the project's success is extremely dependent on the final selling price. A small deviation from the forecast price will have a massive impact on the NPV.
- Least Sensitive Variable: The line for Operating Cost is the flattest. This means that even a significant percentage change in operating costs will have a relatively small effect on the overall profitability.
- Direction of Impact:
- Lines with a positive slope (like Unit Price and Demand) show that as the variable increases, the NPV increases. This makes sense—selling more units or selling them at a higher price improves profit.
- Lines with a negative slope (like Unit Cost and Labour Cost) show that as the variable increases, the NPV decreases. This is also intuitive—higher costs reduce profit.
From a management perspective, this diagram sends a clear message: "We must be very confident in our pricing strategy. Let's invest more time in market research to validate the unit price. We can be less concerned about minor fluctuations in our operating cost estimates."
Alternative View: The Tornado Diagram
The resource also introduces the Tornado Diagram. It presents the exact same information but in a different format. Instead of sloped lines, it uses horizontal bars representing the range of NPV outcomes for each variable. The bars are sorted by length, with the longest (most sensitive) at the top.

This is the 5-year Tornado Diagram from the resource. It clearly shows that 'Unit Price' has the widest range of NPV outcomes and is therefore the most sensitive variable, followed by 'Unit Cost' and 'Demand'.
Both diagrams lead to the same conclusion, but some people find the "tornado" shape more immediately impactful for ranking variables by risk.
Test your understanding!
Looking at the 1-year spider diagram from the resource, which of these two events would have a larger negative impact on the project's NPV?
- An unexpected 15% increase in Labour Cost.
- An unexpected 10% decrease in Demand.
Show answer
The 10% decrease in Demand would have a larger negative impact. The line for 'Demand' is significantly steeper than the line for 'Labour Cost'. A -10% change in demand drops the NPV to approximately -$36,000, while a +15% change in Labour Cost only drops the NPV to about -$33,000. This highlights that sensitivity isn't just about the percentage change, but the variable's inherent impact on the project's finances.
3. Strategic Implications
Identifying the most critical variables is not an academic exercise. It directly informs your project strategy and risk management plan.
Techniques for treating uncertainty and risk
For a more formal discussion on this topic, let's briefly consult a guide from the National Institute of Standards and Technology (NIST).
Please read the short section '4.3.1 Spider Diagram'. Notice how it reinforces the core concept: the diagram provides a picture of the relative importance of different uncertain variables, with the slope indicating sensitivity.
Once your spider diagram has flagged the high-sensitivity variables, you can take targeted action. For a software project, this might involve:
- If 'Demand' or 'User Adoption Rate' is the most sensitive: You should prioritize investing in market analysis, user surveys, and possibly developing a Minimum Viable Product (MVP) to test the market's appetite before committing to full-scale development.
- If 'Development Time' is the most sensitive: You might focus on using a more agile development process, hiring additional developers to reduce the timeline, or using more robust project management tools to mitigate delays.
- If a third-party 'API Cost' is the most sensitive: You would dedicate significant effort to negotiating a favorable, long-term contract with the provider or architecting your system to make it easier to switch to an alternative provider if costs escalate.
The diagram tells you where to spend your most valuable resources: time and money, to reduce uncertainty and mitigate risk.
Conclusion
You've now learned how to bridge the gap between raw data and actionable insight. A spider diagram is an essential communication tool that translates the results of a sensitivity analysis into a clear visual format, making it easy for both technical and non-technical stakeholders to understand a project's risk profile.
- Key Takeaways:
- Spider diagrams visually represent the impact of changes in input variables on a project's financial outcome (like PW or NPV).
- The core principle is that the steepness of a variable's line is proportional to its sensitivity. Steeper means more critical.
- The slope's direction indicates a positive or negative relationship with the project's value.
- Interpreting a spider diagram allows you to identify the most significant risks and strategically allocate resources to manage them.
Preview of the Next Lesson
Sensitivity analysis and spider diagrams are powerful, but they have a limitation: they only change one variable at a time. In the real world, variables often move together. For example, a market downturn could simultaneously lower customer demand and put downward pressure on the price you can charge.
In our next lesson, we will explore scenario analysis, a technique for evaluating a project under different, coherent future conditions (like an optimistic, pessimistic, or most likely scenario) where multiple variables change at once.