Hello! Welcome to our next lesson.
In the last session, we explored how to use spider diagrams to visualize the results of a one-variable sensitivity analysis. We saw how effective they are at identifying which project variables pose the greatest risk. However, we also noted a key limitation: in the real world, factors don't always change in isolation. A challenging economic climate, for instance, might simultaneously reduce customer demand, lower the price they're willing to pay, and increase your financing costs.
Today, we address this by moving from sensitivity analysis to scenario analysis. This lesson is designed to help you apply scenario analysis (e.g., optimistic, pessimistic, most likely) to evaluate projects under different future conditions. Instead of asking "what if this one number changes?", we will ask "what if we find ourselves in this type of future?" This technique provides a more holistic view of a project's potential outcomes and its resilience to systemic changes.
1. From Single Variables to Coherent Scenarios
While sensitivity analysis is like stress-testing individual components of a machine, scenario analysis is like testing the entire machine in different operating environments—a hot desert, a humid jungle, or a freezing arctic.
A scenario is not just a random collection of changed variables. As an entrepreneur who has built businesses, you've intuitively done this when planning for best-case and worst-case futures. Scenario analysis formalizes that process.
Part III Developing Projects and Programs to Deal with Problems
To get a clear, academic definition, let's turn to this chapter from the MIT OpenCourseWare materials on Project Evaluation.
Please read the two paragraphs under the heading 'Scenarios'. Pay close attention to the definition provided: 'A "scenario" is a set of internally consistent assumptions that together provide a vision of a "possible" future'.
The key phrase here is internally consistent. This means the variables are changed in a way that tells a plausible story. For example, a "Recession" scenario wouldn't just involve lower sales; it would likely also include customers being more price-sensitive and perhaps lower inflation on your own costs.
The most common framework for scenario analysis involves three distinct futures:
- Base Case (or Most Likely): This is your original project plan, using the most probable estimates for all variables.
- Pessimistic Case: This describes an unfavorable future. What happens if a major competitor enters the market, a key technology is delayed, or a recession hits?
- Optimistic Case: This describes a highly favorable future. What if user adoption is faster than expected, you achieve viral growth, or a competitor's product fails?
2. Applying Scenario Analysis: A Practical Walkthrough
Now let's move from theory to application. How do you actually perform a scenario analysis and interpret the results?
Using NPV and IRR in Project Investment Decisions
This article from PL Projects provides an excellent, step-by-step guide on how to conduct scenario analysis, complete with a concrete example.
Please read the section titled 'Scenario Analysis'. Focus on the two tables: 'Example scenario definitions' and 'Calculated results'. Observe how multiple variables are adjusted together for each scenario and how this impacts the final NPV, IRR, and Payback Period.
Let's break down the process described in the resource.
Step 1: Define the Scenarios
The first step is to build the narrative for each scenario by adjusting the key variables. Look at the "Example scenario definitions" table from the resource. In the Pessimistic scenario:
- Initial Investment is higher (£275,000).
- Implementation Time is longer (6 months delayed).
- Annual Benefits are lower.
- Benefit Growth is zero.
- The Discount Rate is higher (reflecting higher risk or cost of capital).
Notice how these changes are interconnected and tell a story of a project that is struggling. The opposite is true for the Optimistic scenario.
Step 2: Calculate the Outcomes for Each Scenario
Once the scenarios are defined, you run your financial model (e.g., your Present Worth or Net Present Value calculation) three separate times—once with the inputs from the pessimistic scenario, once with the base case, and once with the optimistic inputs.
The "Calculated results" table in the resource shows the output:
| Scenario | NPV | IRR | Payback Period |
|---|---|---|---|
| Pessimistic | -£8,450 | 10.8% | 5.2 years |
| Base | £59,910 | 23.7% | 3.1 years |
| Optimistic | £145,670 | 38.4% | 2.4 years |
Step 3: Interpret the Range of Outcomes
This is the most important part. You are no longer looking at a single number (£59,910 NPV) but a range of possible outcomes. For the example project:
- The NPV ranges from a small loss of -£8,450 to a large gain of £145,670.
- In the pessimistic case, the project is roughly at breakeven (NPV is slightly negative, and the IRR of 10.8% might be close to the company's minimum acceptable rate). This tells you about the project's downside risk. If things go badly, the company won't lose a huge amount of money.
- The optimistic case shows significant upside potential.
This range gives decision-makers a much richer understanding of the project's risk profile than a single base-case number ever could.
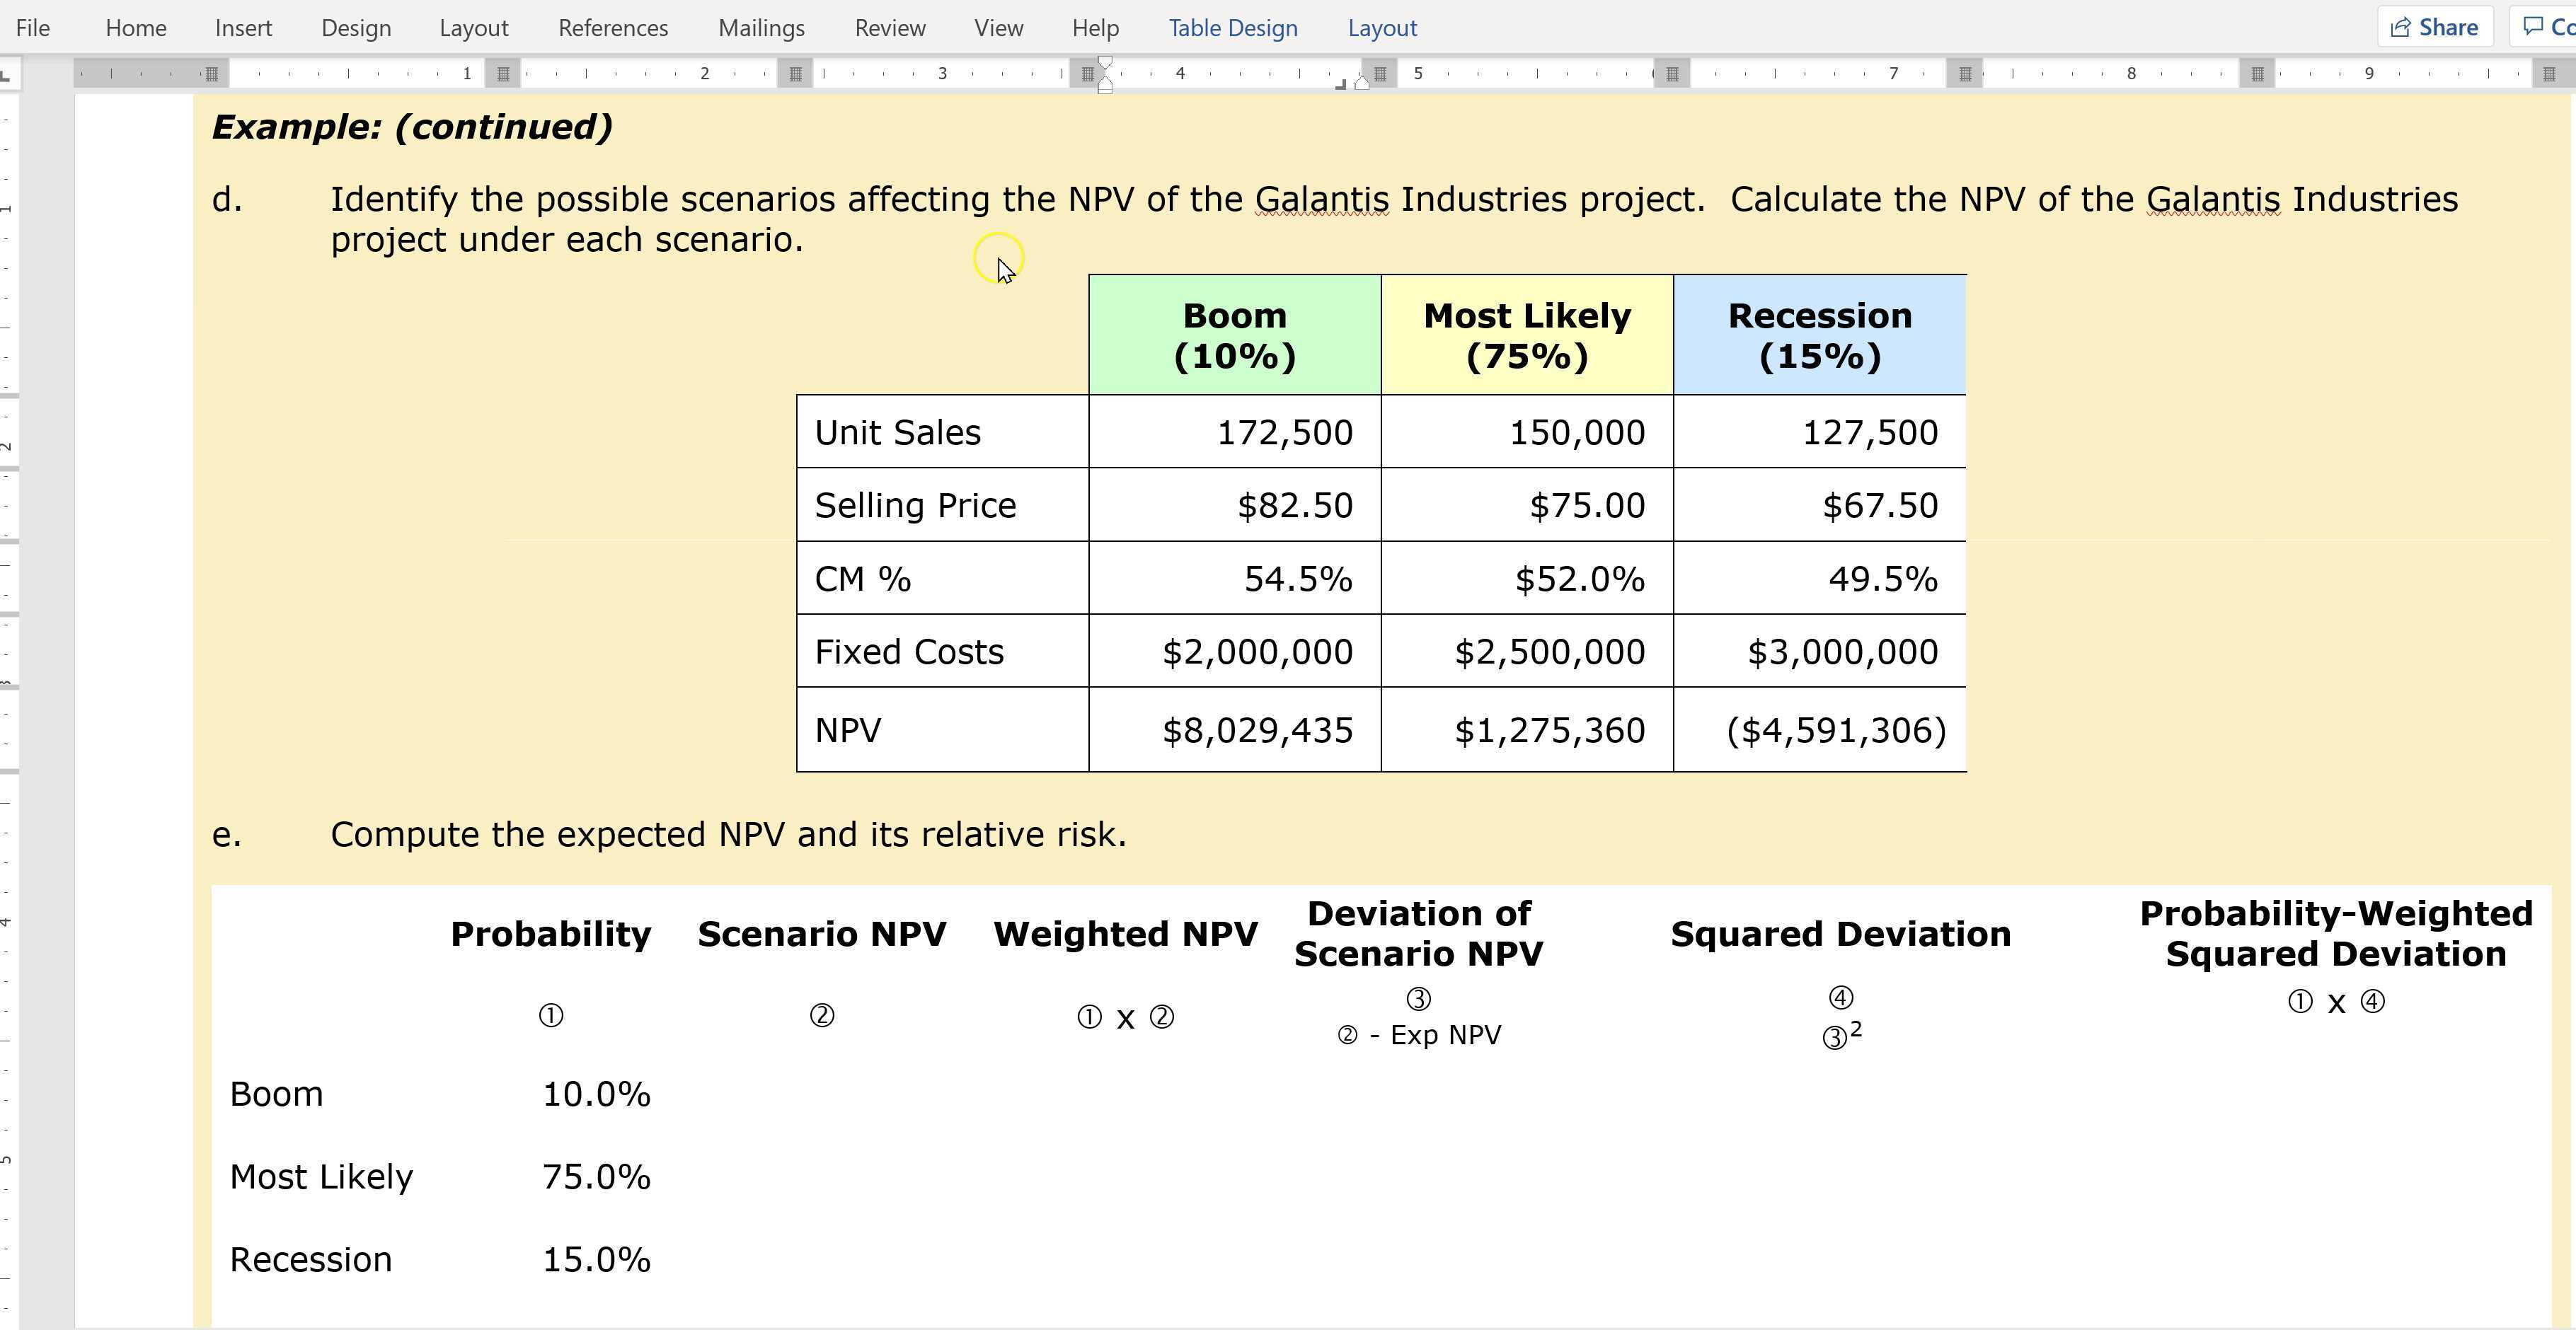
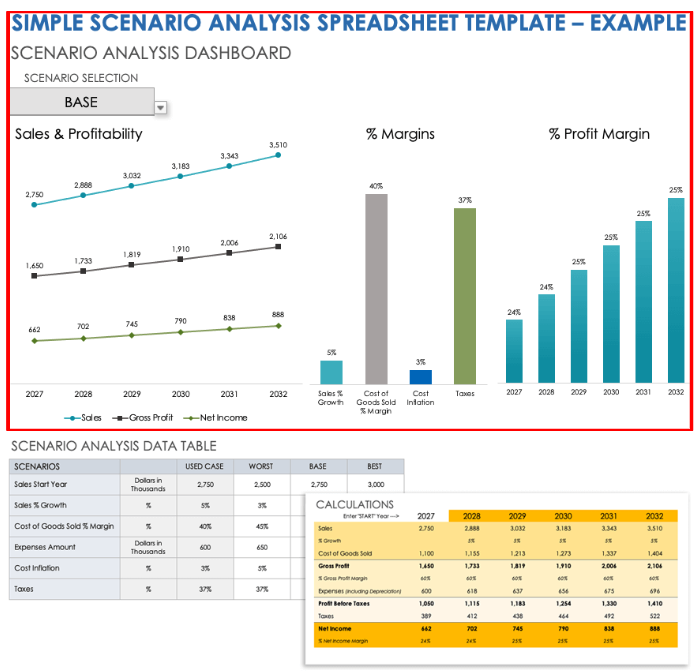
The following images show two different ways this kind of analysis can be structured, one in a report format and one in a spreadsheet—a tool you're likely very familiar with for modeling.
Test your understanding!
Imagine you are evaluating the development of a new Software-as-a-Service (SaaS) product. Your team has established the base case financial model. Your task is to define a plausible Pessimistic Scenario.
Identify 3-4 key variables you would change and explain why they would likely move together in a pessimistic future.
Show answer
A good pessimistic scenario would tell a coherent story. For example, the story could be: "A major, well-funded competitor launches a similar product shortly after we do."
In this scenario, the following variables would likely change together:
- Customer Acquisition Cost (CAC): Would increase, as we now have to spend more on marketing and sales to compete for the same customers.
- Monthly Subscription Price: Would decrease, as we'd be forced to compete on price to win market share.
- Customer Churn Rate: Would increase, as some of our customers might be lured away by the competitor's offerings.
- Initial Development Time: Could increase if we decide to add more features pre-launch to be more competitive, delaying the start of revenue generation.
All these negative changes are driven by a single, plausible event, making the scenario "internally consistent."
3. Communicating Scenario Results
The final step is to communicate your findings. The goal is to present a clear picture of the project's risk and potential, not just to dump a table of numbers on stakeholders.
When presenting your analysis, you should:
- Clearly state the narrative behind each scenario (e.g., "Our pessimistic case assumes a new competitor enters the market...").
- Present the range of outcomes (e.g., "The project's NPV is expected to be £59,910, but could range from a small loss of £8,450 in a pessimistic scenario to a gain of £145,670 in an optimistic one.").
- Use the analysis to build confidence in a decision. For instance: "Even in our pessimistic scenario, the project nearly breaks even, which suggests it is resilient to adverse conditions. Given the significant upside, we recommend moving forward."
Conclusion
Today you've added a powerful and practical tool to your analytical toolkit. By moving beyond single-variable changes, scenario analysis allows you to evaluate your project's performance under comprehensive, realistic future conditions.
- Key Takeaways:
- Scenario analysis evaluates a project's financial outcome under different, internally consistent future states (e.g., optimistic, pessimistic, base case).
- It differs from sensitivity analysis by changing multiple variables at once to tell a plausible story about the future.
- The process involves defining scenarios, calculating the project's PW or NPV for each, and interpreting the resulting range of outcomes.
- This range provides a much deeper understanding of a project's downside risk and upside potential than a single base-case estimate.
Preview of the Next Lesson
Our scenario analysis was based on plausible stories. You might have found yourself thinking, "But how likely is the pessimistic scenario?" That is the perfect question to ask.
In our next lesson, we will begin to answer that by stepping into the world of probabilistic analysis. We will start by defining probability and calculating the expected value for projects, allowing us to weigh different scenarios by their likelihood of occurring.