Welcome to the first numerical-focused lesson of our "Income and Employment" module. In the previous lessons, we built the theoretical foundation for understanding how aggregate demand, consumption, and savings determine an economy's equilibrium. You learned about the consumption function and the crucial difference between equilibrium at full employment and under-employment.
As you requested, we will now pivot to mastering the numerical problems that frequently appear in your CBSE board exams. This lesson is dedicated to calculating the four key "propensities" that describe spending and saving behaviour. Mastering these calculations is the first and most critical step to solving more complex questions on equilibrium and the investment multiplier.
Our learning outcome for today is to: Calculate APC, APS, MPC, and MPS from given income and consumption data.
1. The "Average" Propensities: APC and APS
First, let's look at how to measure the proportion of total income that households consume or save. These are called the Average Propensities.
- Average Propensity to Consume (APC): The ratio of total consumption (C) to total income (Y).
- Average Propensity to Save (APS): The ratio of total savings (S) to total income (Y).
The following video provides a clear explanation with examples.
Value of APC, APS, MPC, MPS & K and Their Relationship. Don't Skip this Easy and Most Important
This video from Sunil Panda explains the concepts of APC and APS, their formulas, and their relationship.
Watch the first two segments: Average Propensity to Consume (APC): Pay attention to the formula and the discussion on why APC can be greater than 1. Average Propensity to Save (APS): Focus on the formula for APS and how it relates back to APC.
Let's summarize the key formulas and the fundamental relationship between APC and APS.
Formulas:
- Average Propensity to Consume (APC) =
- Average Propensity to Save (APS) =
Since all income is either consumed or saved, we have the identity:
If we divide the entire equation by Income (Y), we get:
This simple but powerful relationship is always true. If you know APC, you can instantly find APS, and vice-versa. For example, if APC is 0.8, then APS must be 0.2 (since 1 - 0.8 = 0.2).
2. The "Marginal" Propensities: MPC and MPS
Now, let's consider how consumption and saving change when income changes. This is measured by the Marginal Propensities. This concept is crucial for understanding the multiplier effect we discussed theoretically.
- Marginal Propensity to Consume (MPC): The ratio of the change in consumption (ΔC) to the change in income (ΔY). It tells us what fraction of an additional rupee of income is spent.
- Marginal Propensity to Save (MPS): The ratio of the change in savings (ΔS) to the change in income (ΔY). It tells us what fraction of an additional rupee of income is saved.
Let's return to the video for the explanation.
Value of APC, APS, MPC, MPS & K and Their Relationship. Don't Skip this Easy and Most Important
The video now explains the marginal propensities, which measure the response to a change in income.
Watch the next two segments: Marginal Propensity to Consume (MPC): Focus on how MPC is calculated using the change in C and Y (ΔC and ΔY). Marginal Propensity to Save (MPS): Note the formula and the relationship MPC + MPS = 1.
Here are the key formulas for the marginal propensities.
Formulas:
- Marginal Propensity to Consume (MPC) =
- Marginal Propensity to Save (MPS) =
Where , , and .
Similar to the average propensities, there's a fixed relationship between MPC and MPS. Any change in income must be either consumed or saved:
Dividing the entire equation by the change in income (ΔY), we get:
This means that the fraction of additional income consumed (MPC) plus the fraction of additional income saved (MPS) must always equal 1.
3. A Complete Example
Let's see how all four propensities are calculated from a standard income and consumption schedule. The table below provides a full worked example.
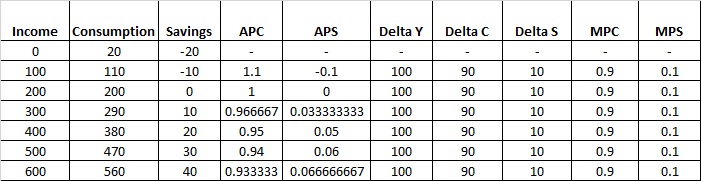
Let's trace the row where Income (Y) = 200:
- C = 200, S = Y - C = 200 - 200 = 0
- APC = C/Y = 200/200 = 1
- APS = S/Y = 0/200 = 0 (Check: APC + APS = 1 + 0 = 1)
- To find MPC and MPS at this level, we look at the change from the previous level (Y=100):
- ΔY = 200 - 100 = 100
- ΔC = 200 - 110 = 90
- MPC = ΔC/ΔY = 90/100 = 0.9
- MPS = 1 - MPC = 1 - 0.9 = 0.1
4. Practice with CBSE Board Questions
Now it's time to apply these formulas, just as you would in your exam. Completing a table with missing values is a very common question format.
Guided Practice: Past Year Question
Let's watch a video where the instructor solves a typical table-based problem. This will give you a clear walkthrough of the steps involved.
Most Important PYQs | Macro Economics | Chapter 7,8,9
This video from Rajat Arora solves a past paper question that requires completing a table by calculating savings and MPS.
Watch the segment from completing the table. Follow along with the calculations. Notice how the instructor uses the relationships (like APC+APS=1) and the core formulas to find the missing values.
The key steps in solving such a problem are:
- Use the relationship Y = C + S to find any missing value in a row if the other two are known.
- Use APC = C/Y or APS = S/Y to find C or S if the propensity is given.
- Calculate the changes (ΔY, ΔC, ΔS) between two consecutive rows.
- Use MPC = ΔC/ΔY or MPS = ΔS/ΔY to find the marginal propensities.
- Remember that MPC + MPS = 1. If you find one, you can easily find the other.
Your Turn: 2024 CBSE Paper Question
Now, try to solve a question from the most recent board paper yourself.
CBSE Class 12 Economics Question Paper 2024 (Set 1
This is Question 12(a) from the 2024 CBSE board exam. It is a table-completion problem, very similar to the one in the video you just watched.
Your task is to fill in the missing values for Savings and MPS in the table provided in the question. Calculate the values on your own before looking at the solution provided in the resource.
Take your time to solve it, then check your work against the provided solution. This is excellent practice for the real exam environment.
5. Test Your Understanding
To build your speed and confidence, it's essential to practice more numericals.

I recommend you try solving questions 1, 2, 3, and 5 from this list. The answers are provided in parentheses, so you can check your work immediately. This type of self-directed practice is one of the most effective ways to prepare.
Conclusion
In this lesson, you've moved from theory to practice, focusing on the essential calculations for the "propensities to consume and save". These skills are the foundation for the entire numerical part of this unit.
Key Takeaways:
- APC (C/Y) and APS (S/Y) measure the proportion of total income consumed/saved. Their sum is always 1.
- MPC (ΔC/ΔY) and MPS (ΔS/ΔY) measure the proportion of additional income consumed/saved. Their sum is also always 1.
- The most common exam questions involve completing a schedule (table) by systematically applying these four formulas and two key relationships.
In our next lesson, we will build directly on this foundation. You will learn how to use the consumption function and MPC to solve for the equilibrium level of income, consumption, and savings in an economy.