Welcome back! In our last lesson, you mastered the browser's developer tools, your "magnifying glass" for inspecting the live, coded version of your website. You learned how to diagnose issues by looking at the HTML structure and CSS rules that bring your page to life.
But how do you know if the code is "correct"? You need something to compare it against—the original source of truth. For us, that's our Figma design.
1. What We Are Learning
Today, you'll learn how to use Figma's Dev Mode to compare your design specifications against the AI-generated code. This is the final and most crucial step in our quality control loop.
Our Analogy:
If browser DevTools is the proofreader checking the final printed book, then Figma Dev Mode is the original manuscript. It contains all the author's original intentions—the exact colors, spacing, and font sizes. A thorough quality check involves comparing the printed book (live code) against the original manuscript (Figma spec) to find any discrepancies.
2. Why This Matters
As a designer in an AI-powered workflow, your expertise isn't just in creating the design, but in certifying that the final product is a perfect translation of that design. Figma Dev Mode is built precisely for this handoff and verification process. It turns your visual design into a technical blueprint.
Mastering this will allow you to:
- Create an "Answer Key": Quickly find the exact CSS values (
padding: 16px,color: #2D3748) that your design requires. - Speak with Precision: Instead of saying "the spacing feels off," you can confidently state, "The Figma design specifies a 32px gap, but the live site has a 24px gap."
- Streamline Your Workflow: Have your design specs and your live code preview side-by-side, creating a powerful "spot the difference" environment.
- Effectively Guide the AI: When you find a mismatch, you can use the precise information from Dev Mode to write a better follow-up prompt for the AI to fix the code.
This skill closes the loop between design, AI generation, and quality assurance.
3. Step-by-Step Instructions
Let's dive into the tool that bridges the gap between your design canvas and the developer's code editor.
Step 1: What is Figma Dev Mode?
Dev Mode is a special workspace within Figma that's tailored for developers and anyone inspecting a design for implementation. It strips away the design tools and presents your layout as a set of technical specifications.
Figma Tutorial: Master Figma Dev Mode in 8 Minutes
To start, let's get a quick overview of what Dev Mode is and why it's so useful. This video from DesignWithArash provides a perfect, concise introduction.
Watch the first 1 minute and 35 seconds (0:00 - 1:35). Focus on understanding its purpose and how to toggle it on. Notice how he mentions setting the language to CSS and the unit to pixels—this is a key first step.
Step 2: Inspecting Your Design's DNA
Now that you've enabled Dev Mode, it's time to inspect. This process will feel very similar to using browser DevTools, but instead of inspecting live code, you're inspecting the design itself.
- Select an element on your canvas (a button, a text block, an image).
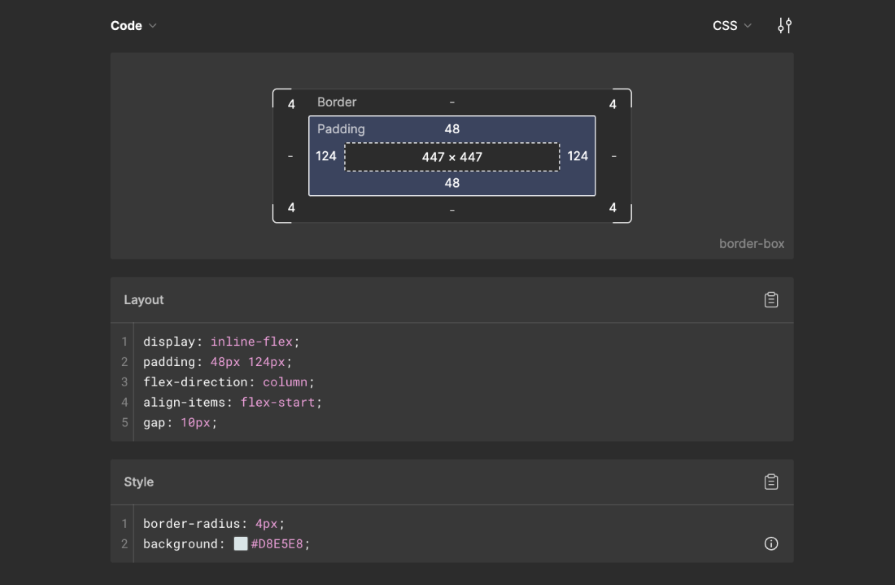
- Look at the Inspect panel on the right. Figma now shows you ready-to-use information.
You'll see familiar concepts presented as code:
Guide to inspecting – Figma Help Center
Figma's help center has a great guide on inspection. Let's read the key sections on measuring distances and viewing properties, as these are the tasks you'll perform most often.
In this article, find the section titled 'I have Dev Mode'. Read the subsections 'Measure distances' and 'View properties'. This will reinforce how to find spacing, colors, and typography details for any selected layer.
Step 3: The Side-by-Side Comparison Workflow
This is where everything comes together. Your goal is to spot the differences between the manuscript (Figma) and the printed book (your live site).
- Arrange Your Windows: Place your Figma window (in Dev Mode) on one side of your screen and your browser window (showing your page via Live Server) on the other.
- Open Your Tools: In your browser, open the Developer Tools (right-click -> Inspect) and dock them to the side.
- Pick an Element to Compare: Let's use a button as an example.
Your verification process looks like this:
| Check | In Figma Dev Mode | In Browser DevTools |
|---|---|---|
| 1. Select | Click the button component on the canvas. | Use the element selector tool to click the button on the live page. |
| 2. Check Color | In the Inspect panel, look under "Style" for the background-color. Note the value. |
In the Styles panel, find the background-color property that is active (not crossed out). Is the value the same? |
| 3. Check Spacing | Look at the Layout section for the padding values. Note them down. |
Go to the Computed tab and look at the Box Model diagram. Do the padding values match Figma? |
| 4. Check Font | Look under Typography for font-family, font-size, and font-weight. |
In the Styles or Computed tab, find the font properties. Do they match? |
By systematically moving through elements and comparing these key properties, you can create a clear list of any bugs or inaccuracies the AI introduced.
Step 4 (Advanced): Seeing What's Changed in Figma
Dev Mode has another powerful feature called "Compare changes." This is incredibly useful if you've made tweaks to the design after the initial code was generated. It lets you see exactly what was modified between versions.
Figma Tutorial: Master Figma Dev Mode in 8 Minutes
Let's go back to the 'Master Figma Dev Mode' video to see this feature in action. It's like a visual version history for developers.
Watch the segment from 6:09 to 7:53. Pay attention to how Figma highlights what has been edited and even shows the old vs. new properties side-by-side.
This feature ensures that developers (or in our case, our AI assistant) are always working from the latest version of the design and can quickly spot what they need to update.
4. What Could Go Wrong
- "I don't see the Dev Mode toggle."
- Reason: Dev Mode is a feature available on paid Figma plans (Professional, Organization, and Enterprise). You may also need to be designated a "Full" or "Dev" seat in your team's plan.
- Fix: Check your Figma plan. For our purposes, a Professional plan is sufficient.
- "The units in Figma say
1rembut I designed in pixels (16px)."- Reason: Dev Mode can be configured to show different units.
remis a relative unit popular in web development, where1remis often equal to16px. - Fix: As shown in the first video, you can click the settings in the Inspect panel to switch the units between
pxandremto match what you're comfortable with. For now, usingpxis perfectly fine.
- Reason: Dev Mode can be configured to show different units.
- "The CSS code snippet in Figma doesn't look exactly like the AI's code."
- Reason: This is normal. There are often multiple ways to write CSS to achieve the same visual result. For example, centering an item can be done with Flexbox, Grid, or other methods.
- Fix: Don't worry about matching the code character-for-character. Focus on comparing the computed values for key properties (like the final pixel value for padding, the hex code for color, etc.) and the overall visual match.
5. Mini Exercise
Time to perform your first design-to-code audit.
- Open your project's Figma file. Switch to Dev Mode.
- Open your
index.htmlfile in the browser using Live Server. - Arrange the two windows side-by-side and open browser DevTools.
- Task 1: Audit the Main Heading (
<h1>).- In Figma, select your main heading. In the Inspect panel, find and write down its
color,font-size, andfont-weight. - In the browser, inspect the
<h1>element. Find the same three properties in the Styles or Computed panel. - Do the values match?
- In Figma, select your main heading. In the Inspect panel, find and write down its
- Task 2: Audit a Container's Padding.
- In Figma, select a major container or section frame. Find its
paddingvalues in the Inspect panel. - In the browser, inspect that same section. Go to the Computed tab and check the
paddingvalues in the box model diagram. - Are they identical?
- In Figma, select a major container or section frame. Find its
This simple comparison is the foundation of quality control in a design-to-code workflow.
6. Checklist Before Moving Ahead
- I understand that Dev Mode is a view in Figma for inspecting design specifications.
- I know how to toggle Dev Mode on and off.
- I can select an element and find its CSS properties (like color, padding, font-size) in the Inspect panel.
- I understand the side-by-side workflow for comparing Figma Dev Mode specs with browser DevTools output.
- I know that the goal is to match the final computed values and visual appearance, not necessarily the exact code structure.
Excellent work. You've now completed the quality control loop. You know how to generate code with an AI, preview it live, inspect it for bugs with browser DevTools, and now, compare it against the original blueprint using Figma's Dev Mode.
A Look Ahead:
Our website is looking great on our local machine, but it's not very useful if only we can see it. In the next lesson, we'll take the final, exciting step: deploying our website to the internet. You'll learn how to use a service called Vercel to take your project from your computer and make it live for the whole world to see.