Welcome back! In the last lesson, we set up our "live preview" environment using Live Server. This gives us the ability to see our AI-generated webpage instantly, just like hitting the "Present" button in Figma to view a prototype.
But what happens when the preview doesn't match the design? How do you figure out why a button is the wrong color or the spacing is off? Just looking at it isn't enough; we need to investigate.
1. What We Are Learning
Today, you'll learn how to use browser developer tools to inspect elements and identify CSS issues. This is the single most important skill for quality control in web development.
Our Analogy:
Think of your browser's developer tools (or "DevTools") as the ultimate inspector panel for a live website. In Figma, you can click on any layer to see its properties in the Design panel on the right—its fill color, stroke, padding, constraints, etc. DevTools lets you do the exact same thing, but for the HTML elements on your live webpage. It lets you click on anything you see and view all the code and CSS rules that are making it look that way.
2. Why This Matters
As someone focused on an AI-assisted workflow, your primary role shifts from writing code to verifying it. The AI will generate the HTML and CSS, but it won't always be perfect. DevTools is your magnifying glass and your measuring tape. It helps you:
- Diagnose Problems: Pinpoint the exact CSS rule that's causing a visual bug.
- Bridge Design and Code: See how Figma properties like "padding" and "color styles" translate directly into CSS properties like
paddingandcolor. - Test Solutions Instantly: Temporarily change CSS values directly in the browser to experiment with fixes before you even touch the code files.
- Communicate Clearly: Instead of saying "the button is too low," you can say "the button needs its
margin-topchanged from24pxto16px."
Mastering DevTools is the key to moving from a designer who requests changes to a partner who can diagnose issues and suggest solutions.
3. Step-by-Step Instructions
Let's start with a fantastic video from a designer's perspective. It shows how "Inspect Element" can become a core part of your design review process.
How to use Inspect Element to improve your design reviews! 🔍
This video from CharliMarieTV is a perfect introduction. She demonstrates how a designer can use browser tools to peek 'behind the curtain' and provide much better feedback to developers.
Watch from the beginning until 2:17. Focus on the two main actions: how to open the developer tools and how hovering over the code highlights the corresponding elements on the page, including their spacing (margin and padding). Note that she uses Safari, but the process in Chrome is nearly identical.
Now, let's break this down into a structured process using your own project.
Step 1: Open Your Project and DevTools
First, get your project running so we have something to inspect.
- In VS Code, open your project folder.
- Start Live Server to view your page in Chrome (or your preferred browser).
- On your webpage, right-click on any element, like your main heading, and select Inspect.
This will open the Developer Tools panel. It might appear on the bottom, on the right, or in a separate window. You can change this by clicking the three-dot menu inside the DevTools panel and choosing a different "Dock side". Docking to the right is often most convenient.
Step 2: Understand the DevTools Interface
You'll see two main areas that work together.

- The Elements Panel (on the left): This is your HTML structure, often called the DOM Tree. It's like the Layers Panel in Figma. You can see how elements are nested inside each other.
- The Styles Panel (on the right): This is where the CSS magic happens. It's like the Design Panel in Figma. When you select an element in the Elements panel, this area shows all the CSS rules that apply to it.
Step 3: Inspecting an Element and Its Styles
Let's find the CSS for a specific element.
- In the top-left of the DevTools panel, click the element selector icon (it looks like a square with a pointer).
- Now, move your mouse over your webpage. You'll see elements get highlighted.
- Click on your main heading.
DevTools will automatically select the corresponding HTML tag in the Elements panel and show all of its CSS rules in the Styles panel.
You may notice some CSS properties in the Styles panel have a line through them. This is incredibly useful!
Chrome Dev Tools Debugging CSS
A property with a line through it means it's being overridden by another, more specific style. This is a core concept of CSS called the 'cascade.' This short clip from the 'Chrome Dev Tools Debugging CSS' video explains it perfectly.
Watch the segment from 6:17 to 7:25. It explains exactly what the strikethrough means and how it helps you figure out which style is actually being applied.
Step 4: Investigating Spacing with the Box Model
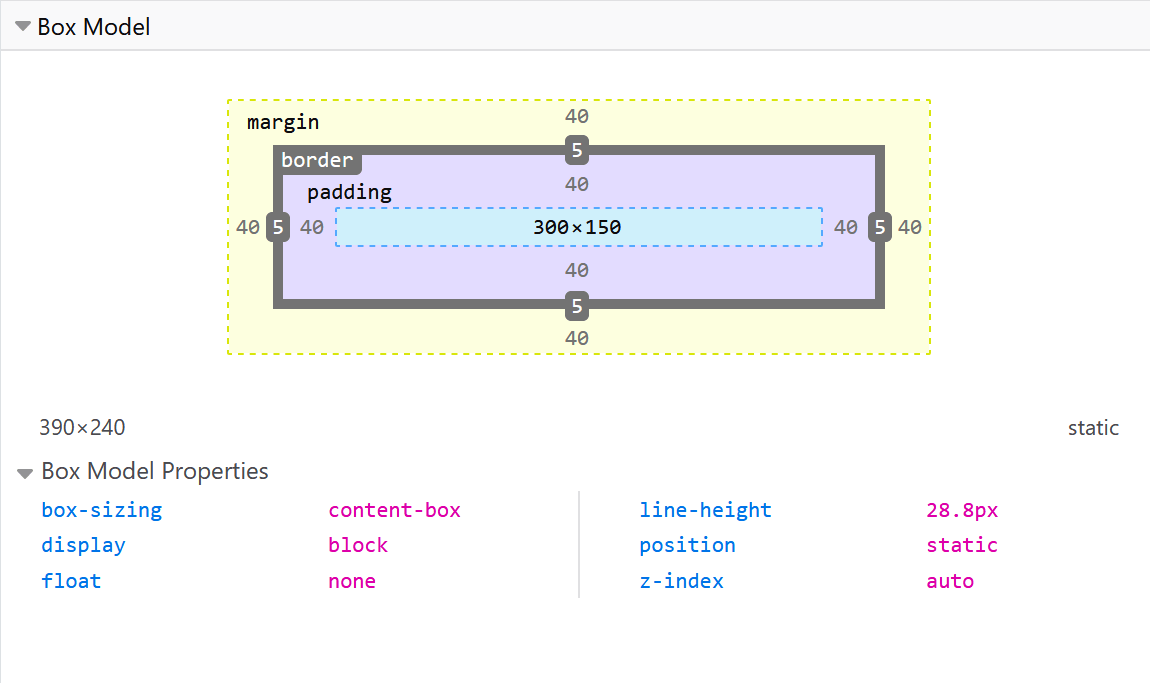
One of the most common mismatches between a design and code is spacing. DevTools gives you a visual tool that directly maps to the box model you already know.
As a designer, you're an expert on the box model (content, padding, border, margin). DevTools has a specific view for this that makes debugging layouts much easier. This Codecademy article shows you where to find it.
Read the section '1. View Box Model Dimensions with DevTools'. This will guide you to the 'Computed' tab where the interactive box model diagram lives.
After selecting an element, click the Computed tab (it's usually next to the Styles tab). You'll see this diagram:
Step 5: Testing Changes Live (The "What-If" Tool)
This is the most powerful feature for quality control. You can edit CSS live in the browser to test your theories.
How to use Inspect Element to improve your design reviews! 🔍
Let's revisit the video from CharliMarieTV to see how to temporarily edit CSS values. This lets you experiment with fixes without any risk.
Watch from 2:36 to 3:45. Pay attention to how she clicks on a value (like margin-top), types a new number, and also uses the arrow keys to 'nudge' the value up and down. This is an incredibly fast way to find the perfect value.
Try it yourself:
- Select an element.
- In the Styles panel, find a property like
colororfont-size. - Click on the value (e.g.,
#333333or24px). - Type a new value (e.g.,
redor32px) and press Enter. The page will update instantly!
Important: These changes are temporary! They only exist in your browser session. If you reload the page, they will disappear. The goal is to find the right fix, then go back to your style.css file in VS Code and make the permanent change.
4. What Could Go Wrong
- My changes in DevTools disappeared!
- Reason: This is expected behavior. DevTools is a temporary playground for inspection and testing.
- Fix: Once you find a fix you like, you must apply that change to your actual CSS file in VS Code and save it.
- I'm trying to change a style, but it's crossed out.
- Reason: The property you're trying to edit is being overridden by a more specific rule.
- Fix: Look further down the list in the Styles panel for the same property that is not crossed out. That's the one you need to edit.
- The text says an element has margin, but I don't see it.
- Reason: Sometimes margins on adjacent elements "collapse" into each other.
- Fix: Use the Box Model diagram in the
Computedtab. Hovering over themarginsection of the diagram will always highlight the exact space on the page, making it clear where the space is coming from.
5. Mini Exercise
Time to be a detective.
- Make sure your project is running with Live Server.
- Open DevTools by right-clicking your page and choosing Inspect.
- Task 1: Change a color.
- Use the element selector to click on a heading or a paragraph.
- In the Styles panel, find the
colorproperty. - Click the value and change it to something obvious, like
blueorpurple.
- Task 2: Investigate spacing.
- Find an element that has space above or below it. Select it.
- Go to the Computed tab to view the Box Model diagram.
- Hover over the
marginandpaddingsections of the diagram. Which one is creating the space? - Double-click the value for the margin or padding and change it to
0. Watch the space disappear.
- Task 3: Reset.
- Reload the webpage. Confirm that all your temporary changes are gone and the page is back to its original state.
Completing this exercise means you now have the fundamental skills to diagnose why AI-generated code might not match your Figma design.
6. Checklist Before Moving Ahead
- I know how to open DevTools by right-clicking an element and selecting "Inspect".
- I can use the element selector tool to target a specific part of my page.
- I can tell the difference between the Elements panel (HTML) and the Styles panel (CSS).
- I understand that a strikethrough on a CSS property means it has been overridden.
- I can find and use the Box Model diagram in the "Computed" tab to identify margin and padding.
- I know how to temporarily change a CSS value in the Styles panel to test a visual fix.
Fantastic work. You've just unlocked the most critical tool for ensuring high-quality results from your AI coding assistant. Being able to inspect, diagnose, and test is what separates a passive user from an effective director of AI.
A Look Ahead:
Now that you can inspect the code, how do you compare it efficiently to your original design? In our next lesson, we'll tighten the feedback loop even further by using Figma's Dev Mode. This will allow you to have your Figma design specs side-by-side with your browser's DevTools, making pixel-perfect comparisons a breeze.