Hello! Let's dive into our next lesson.
Introduction
In our last session, we focused on fitting a linear regression model to our training data and interpreting its coefficients. We successfully built a model that minimizes error on the data it has seen. However, the true test of a machine learning model is not how well it performs on data it already knows, but how well it generalizes to new, unseen data.
This lesson addresses that fundamental question. We will explore two critical sources of prediction error: bias and variance. Understanding these concepts is essential for diagnosing why a model might not be performing well and is the key to grasping the trade-off between model simplicity and complexity. This will directly prepare us for the next topic: techniques to prevent models from becoming too complex.
Defining Bias and Variance Intuitively
At a high level, bias and variance describe two different kinds of errors a model can make. Bias is about a model's underlying assumptions, while variance is about its sensitivity to the data it was trained on.
To build a strong intuition, let's start with a fantastic visual explanation from StatQuest.
Machine Learning Fundamentals: Bias and Variance
This video, 'Machine Learning Fundamentals: Bias and Variance', uses a simple and memorable analogy of a 'straight line' versus a 'squiggly line' to introduce the core ideas.
Watch the segment from 01:37 to 06:11. Focus on: Why the straight-line model has high bias (it's too simple to capture the true, curved relationship). Why the squiggly-line model has high variance (it fits the training data perfectly but fails on the testing data). The summary of the trade-off and the goal of finding a 'sweet spot'.
Let's break down the concepts from the video:
-
Bias: This is the error from a model's incorrect assumptions. The "straight line" model had high bias because it assumed the relationship was linear, when it was actually curved. High-bias models are often too simple and fail to capture the underlying patterns in the data. This leads to systematic, consistent errors.
-
Variance: This is the error from a model's excessive sensitivity to small fluctuations in the training data. The "squiggly line" model had high variance because it learned the noise in the training set, not just the signal. If we trained it on a different sample of data, the model would change drastically. High-variance models are often too complex.
A classic way to visualize this is with a target analogy. Imagine the bullseye is the true value we want to predict.

The Link to Underfitting and Overfitting
Bias and variance are directly related to two common problems in machine learning: underfitting and overfitting.
-
High Bias → Underfitting: A model that is too simple underfits the data. It performs poorly on the training set and also performs poorly on the test set. It just doesn't have the capacity to learn the important patterns.
-
High Variance → Overfitting: A model that is too complex overfits the data. It memorizes the training set, including its noise. It performs exceptionally well on the training set but fails to generalize, leading to poor performance on the test set.
This article provides a very practical walkthrough using a real-world example of predicting golfers based on weather. It clearly shows how training and test errors reveal underfitting and overfitting.
Bias-Variance Tradeoff, Explained: A Visual Guide with Code ...
Read these sections from 'Bias-Variance Tradeoff, Explained' on Towards Data Science. They connect the concepts directly to model performance metrics you can observe.
First, read the section 'Understanding Bias (When Models Underfit)'. Note how the simple model has similarly high error on both training and test data. Then, read 'Understanding Variance (When Models Overfit)' and see how the complex model has zero training error but high test error.
To summarize the key diagnostic signs:
| Problem | Symptom | Training Error | Test Error |
|---|---|---|---|
| Underfitting | High Bias, Low Variance | High | High |
| Overfitting | Low Bias, High Variance | Low | High |
| Good Balance | Low Bias, Low Variance | Low | Low |
The Bias-Variance Trade-Off
You can't just minimize both bias and variance independently. There is an inherent trade-off between them that is governed by model complexity.
- As you make a model more complex (e.g., adding more features to linear regression, or allowing a decision tree to be deeper), its bias decreases (it can fit the training data better), but its variance increases (it becomes more likely to overfit).
- As you make a model less complex (simpler), its variance decreases (it's less sensitive to noise), but its bias increases (it might miss the true underlying patterns).
This relationship is perfectly captured in the following graph, which is one of the most important conceptual diagrams in machine learning.
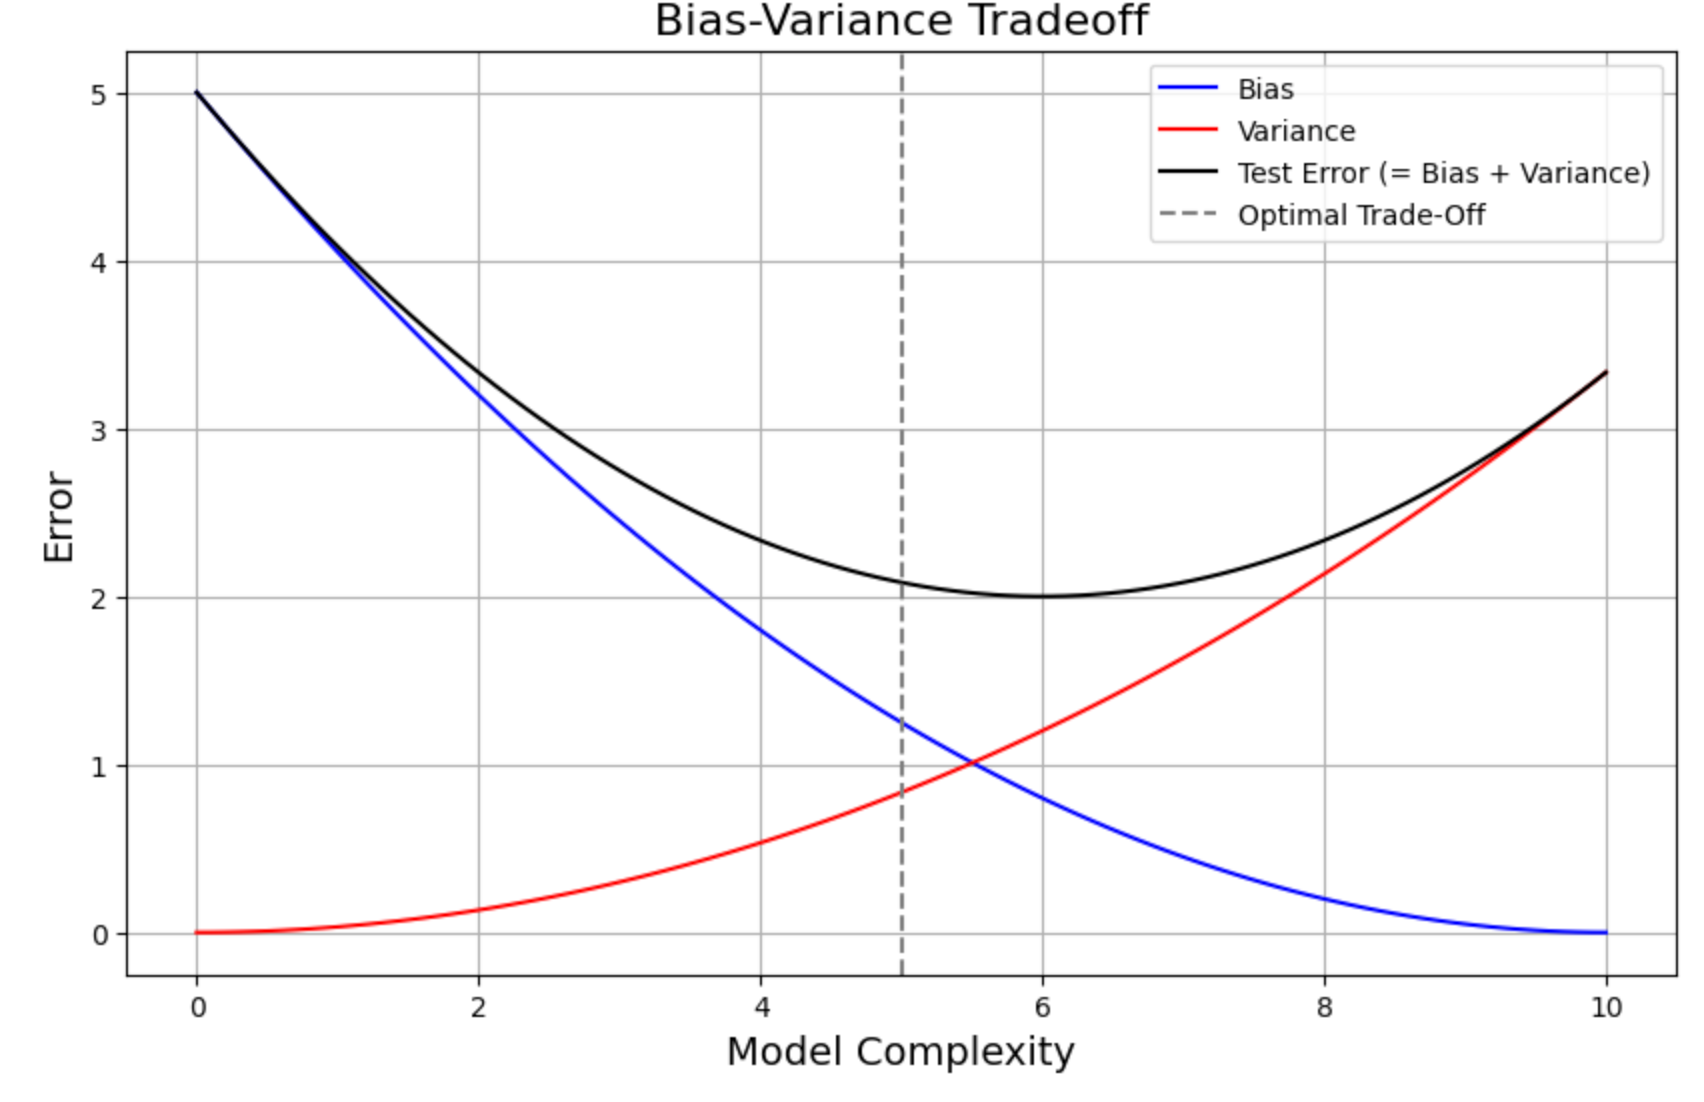
The golf course example from the article you read provides concrete numbers for this curve. The model with a "depth" of 3 was the sweet spot, achieving the lowest test error by balancing the simplicity of the depth 1 model (high bias) and the complexity of the depth 5 model (high variance).
Conclusion
Today, you've learned about the fundamental challenge in building predictive models: managing the trade-off between bias and variance.
Key Takeaways:
- Bias is a model's systematic error due to its simplifying assumptions. High bias leads to underfitting.
- Variance is a model's sensitivity to the specific training data. High variance leads to overfitting.
- There is a trade-off: increasing model complexity reduces bias but increases variance.
- The goal is to find the "sweet spot" in model complexity that minimizes the total error on unseen test data. The relationship between training error and test error is your primary guide for diagnosing whether your model is underfitting, overfitting, or well-balanced.
Preview of the Next Lesson
We've seen that overly complex models tend to overfit. This begs the question: how can we use a complex model without it overfitting? In the next lesson, we will explore regularization techniques like Ridge and LASSO regression. These methods are designed specifically to combat high variance by adding a penalty for model complexity, helping us find that "sweet spot" automatically.