Introduction
Welcome back. In our last lesson, you architected the emotional core of your story: a powerful crisis scene where the husband's (Alex's) suppressed anxieties finally erupt, shattering the fragile peace of the vee. This scene, driven by the collision of a System Limiter and a Decision Paradox, serves as a major turning point where subtext becomes text and the true cost of the arrangement is laid bare.
Today, we zoom out from that single explosive moment to design the entire emotional journey for the reader. Our learning outcome is to: Map the desired emotional arc for the vee story, plotting the rise of tension from the opening to the resolution.
This means we're not just stringing plot events together; we are consciously designing the reader's emotional experience. We'll look at how to structure the story's highs and lows to make the final, consented intimacy feel not just plausible, but deeply satisfying and earned.
To begin, let's clarify a key concept. A story has two arcs working in tandem:

The Emotional Plot
Every event in your story is an opportunity to make the reader feel something. The most effective stories are built not just on external events, but on an "emotional plot" that runs parallel to them.
Let's watch a short video that explains this idea.
Why 90% of Fiction Writers Fail to Connect with Readers
In this clip from the video 'Why 90% of Fiction Writers Fail to Connect with Readers,' John Fox from Bookfox discusses the concept of an 'emotional plot.' This is the idea of structuring your story around the characters' internal and emotional realities, rather than just external stakes.
Please watch from 07:28 to 08:32. Pay close attention to the distinction between external stakes (terrorists in Die Hard) and personal, emotional stakes (John McClane's internal angst and relationship with his wife). This is the principle we'll apply today.
As the video suggests, we should "treat plot events as emotional opportunities." For your vee story, the external plot might involve dates, conversations, and shared living arrangements. The emotional plot, however, tracks the internal journey of Alex, Vera, and Leo through hope, jealousy, fear, and finally, genuine acceptance.
Visualizing the Story's Emotional Shape
Given your background in statistics, you might appreciate a more graphical way to think about a story's emotional journey. The writer Kurt Vonnegut famously lectured on "the shapes of stories," plotting them on a simple graph.
Kurt Vonnegut on the Shapes of Stories
Let's watch Kurt Vonnegut explain his method. He uses a 'Good Fortune/Ill Fortune' axis and a 'Beginning/End' axis to map the emotional trajectory of classic stories. This provides a powerful, visual tool for understanding narrative structure.
Watch the beginning from 00:20 to 01:09 to understand his graphing concept. Then, pay close attention to his analysis of the 'Cinderella' story shape from 02:16 to 04:34. Notice how it's not a simple upward line but includes a dramatic drop before the ultimate 'off-scale happiness.'
Vonnegut's "Cinderella" arc is a perfect model for what we aim to achieve. The story doesn't just move from bad to good. It rises with the Fairy Godmother's magic, then plunges at midnight, creating a moment of profound loss and uncertainty. This plunge makes the final happy ending feel far more triumphant.
Your crisis scene from the previous lesson is your story's "midnight." It's the low point that must occur before the characters can find a true and sustainable resolution.
Structuring the Arc: Escalating Crises
Your goal is to build intense friction to make the resolution feel real. A narrative model that excels at this is the Fichtean Curve, which is built around a series of escalating crises.
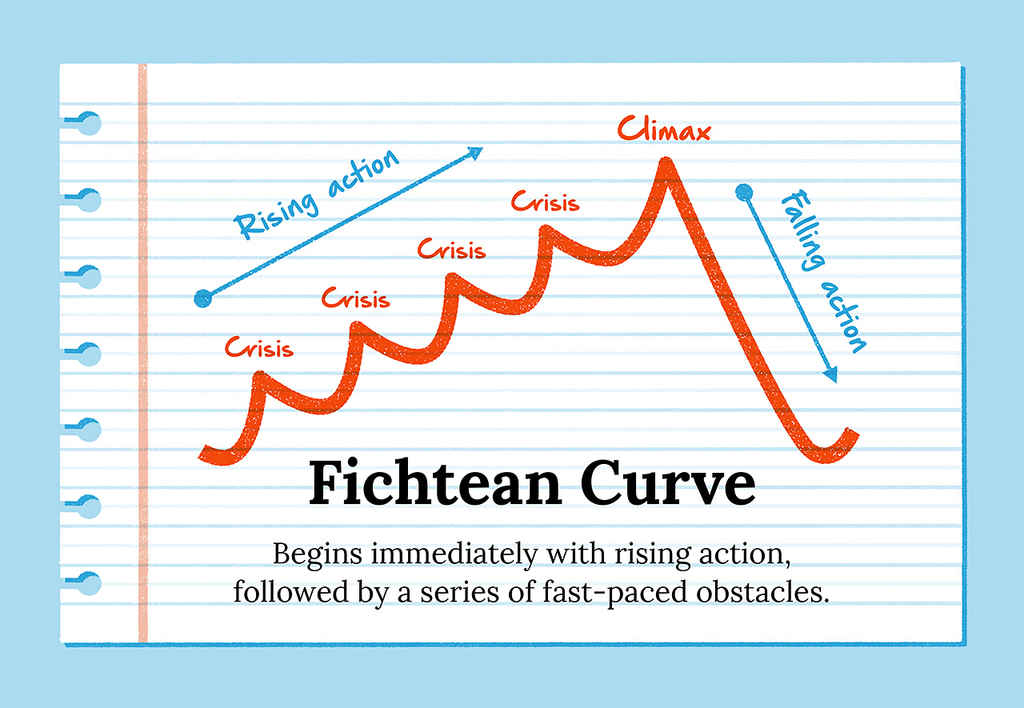
This shape visually represents our goal: not just one conflict, but a chain of them, each raising the emotional stakes. To place these crises rhythmically, we can use a structural guideline.
The 12% Rule of Story Structure
The article 'The 12% Rule of Story Structure' by September C. Fawkes offers a fantastic 'rule of thumb' for pacing your story. It breaks down a narrative into key turning points that occur at regular intervals. This provides a mathematical-like skeleton for our emotional curve.
Please read the article, paying special attention to the descriptions of the turning points at these approximate markers: ~12% (Inciting Incident) ~25% (Plot Point 1) ~50% (Midpoint) ~75% (Plot Point 2) ~87% (The Turn toward Climax) \nThink about how each of these could represent an escalating 'crisis' on the Fichtean curve for your vee story.
The 12% rule gives us the anchor points for our emotional graph. Plot Point 2 at ~75% is the perfect location for the crisis scene you outlined, representing the story's major low point before the final ascent.
Your Task: Map the Emotional Arc of the Vee Story
Now, let's combine these ideas into a practical exercise. Your task is to create an emotional arc map for your vee story. You can sketch this on paper or describe it textually.
Instructions (35 minutes):
-
Define Your Axes:
- X-Axis (Horizontal): Story Timeline, from 0% (Beginning) to 100% (End).
- Y-Axis (Vertical): Emotional State (Vonnegut's GI-Axis). Let's define it for your story. It represents the overall health and hope for the vee relationship.
- +10: Earned Consent & Harmony (Compersion, stability, authentic connection)
- 0: Status Quo / Uncertainty
- -10: Crisis & Despair (Jealousy, betrayal, imminent breakup)
-
Plot the Major Turning Points:
Using the 12% rule as a guide, place at least five key events from your story on the graph. For each point, provide the approximate percentage, the plot event, its Y-axis value, and a one-sentence justification.Example:
- Point: Plot Point 2
- Percentage: ~75%
- Plot Event: Alex's outburst during dinner, revealing he never truly consented.
- Emotional Value: -8
- Justification: This is the story's "midnight," where the illusion of harmony is destroyed, and the entire relationship is on the brink of collapse.
Here are the points you should plot:
- Hook/Opening (~1-5%): Where does the story start emotionally? Is it a neutral state, or is there already underlying tension?
- Plot Point 1 (~25%): The point of no return. The characters commit to trying the vee. What is the emotional charge of this moment? (Hint: It might be positive for Vera/Leo but negative for Alex, resulting in a complex, near-zero average).
- Midpoint (~50%): A major revelation or shift. The stakes are raised significantly. Perhaps Alex sees undeniable proof of Vera and Leo's deep emotional bond.
- Plot Point 2 (~75%): Your crisis scene.
- Final Turn (~87%): The moment after the crisis where the characters begin to rebuild on a foundation of honesty. This is the start of the true resolution.
- Climax (~95%): The scene of consented intimacy. This should be the highest point on your graph.
-
Add the "Zigzag":
Between these major points, think about the smaller emotional ups and downs. Briefly describe one or two smaller events that cause these fluctuations. For instance:- A moment of intense New Relationship Energy (NRE) between Vera and Leo might create a positive spike for them but a dip for Alex.
- A surprisingly warm and friendly conversation between Alex and Leo could create a brief, hopeful plateau.
Your final output should be a clear description of the emotional journey you want your reader to experience, anchored by the key structural moments of your plot.
Conclusion
By mapping your story's emotional arc, you move from being a writer of scenes to an architect of feelings. You've learned to visualize the emotional shape of your story using Vonnegut's graphing concept and to structure it for maximum impact with tools like the Fichtean Curve and the 12% rule. This map is not a rigid cage but a powerful blueprint that ensures your plot events are always serving the core emotional journey.
Key Takeaways:
- Effective stories are built on an "emotional plot" that dictates the reader's feelings.
- Visualizing the story's shape (like the "Cinderella" arc) helps in crafting a journey with satisfying highs and necessary lows.
- Structural frameworks like the Fichtean Curve and the 12% Rule provide a reliable rhythm for placing turning points and escalating tension.
- A story's emotional arc is a "zigzag," full of smaller peaks and valleys between major turning points.
Preview of the Next Lesson
In our next lesson, we will officially begin Module 11: Drafting the Complete Short Story Plot. With the emotional map you've just created as our guide, our first step will be to sequence all previously developed plot points and techniques along the emotional arc to control the pacing of conflict and revelation. We will start assembling all the individual pieces you've built into a cohesive, powerful whole.