Hello! Over the last few lessons, we've implemented powerful optimization techniques for images, JavaScript, and fonts. You've learned the how and why behind building a fast website with Astro. But how do we prove it? How do we quantify our success and ensure the site stays fast over time?
This lesson provides the answer. We'll transition from implementing optimizations to measuring their impact. By the end of this session, you will be able to use Lighthouse to measure and analyze site performance against Core Web Vitals benchmarks. This is a critical skill for delivering on your goal of a high-performance, SEO-friendly accounting website that meets professional standards.
We will cover how to run a Lighthouse audit, how to interpret the results—especially the Core Web Vitals—and how to use its feedback to pinpoint areas for improvement.
1. What is Lighthouse and How to Run an Audit
Lighthouse is an open-source, automated tool developed by Google for improving the quality of web pages. It audits for performance, accessibility, best practices, and SEO. Since you're a web developer, you'll be pleased to know it's built directly into Chrome DevTools, making it incredibly accessible.
To get started, let's look at how to run your first audit. It's a straightforward process:
- Navigate to the webpage you want to audit in Google Chrome. It's best to use an Incognito window to prevent browser extensions from interfering with the results.
- Open Chrome DevTools by pressing
F12(orCmd+Option+Ion Mac). - Navigate to the Lighthouse tab.
- Select the categories you want to audit (for now, let's keep them all checked).
- Choose the device: Mobile or Desktop. Always start with Mobile, as it's a more constrained environment and often reveals performance issues more clearly.
- Click "Analyze page load".
After a minute or so, Lighthouse will generate a report.
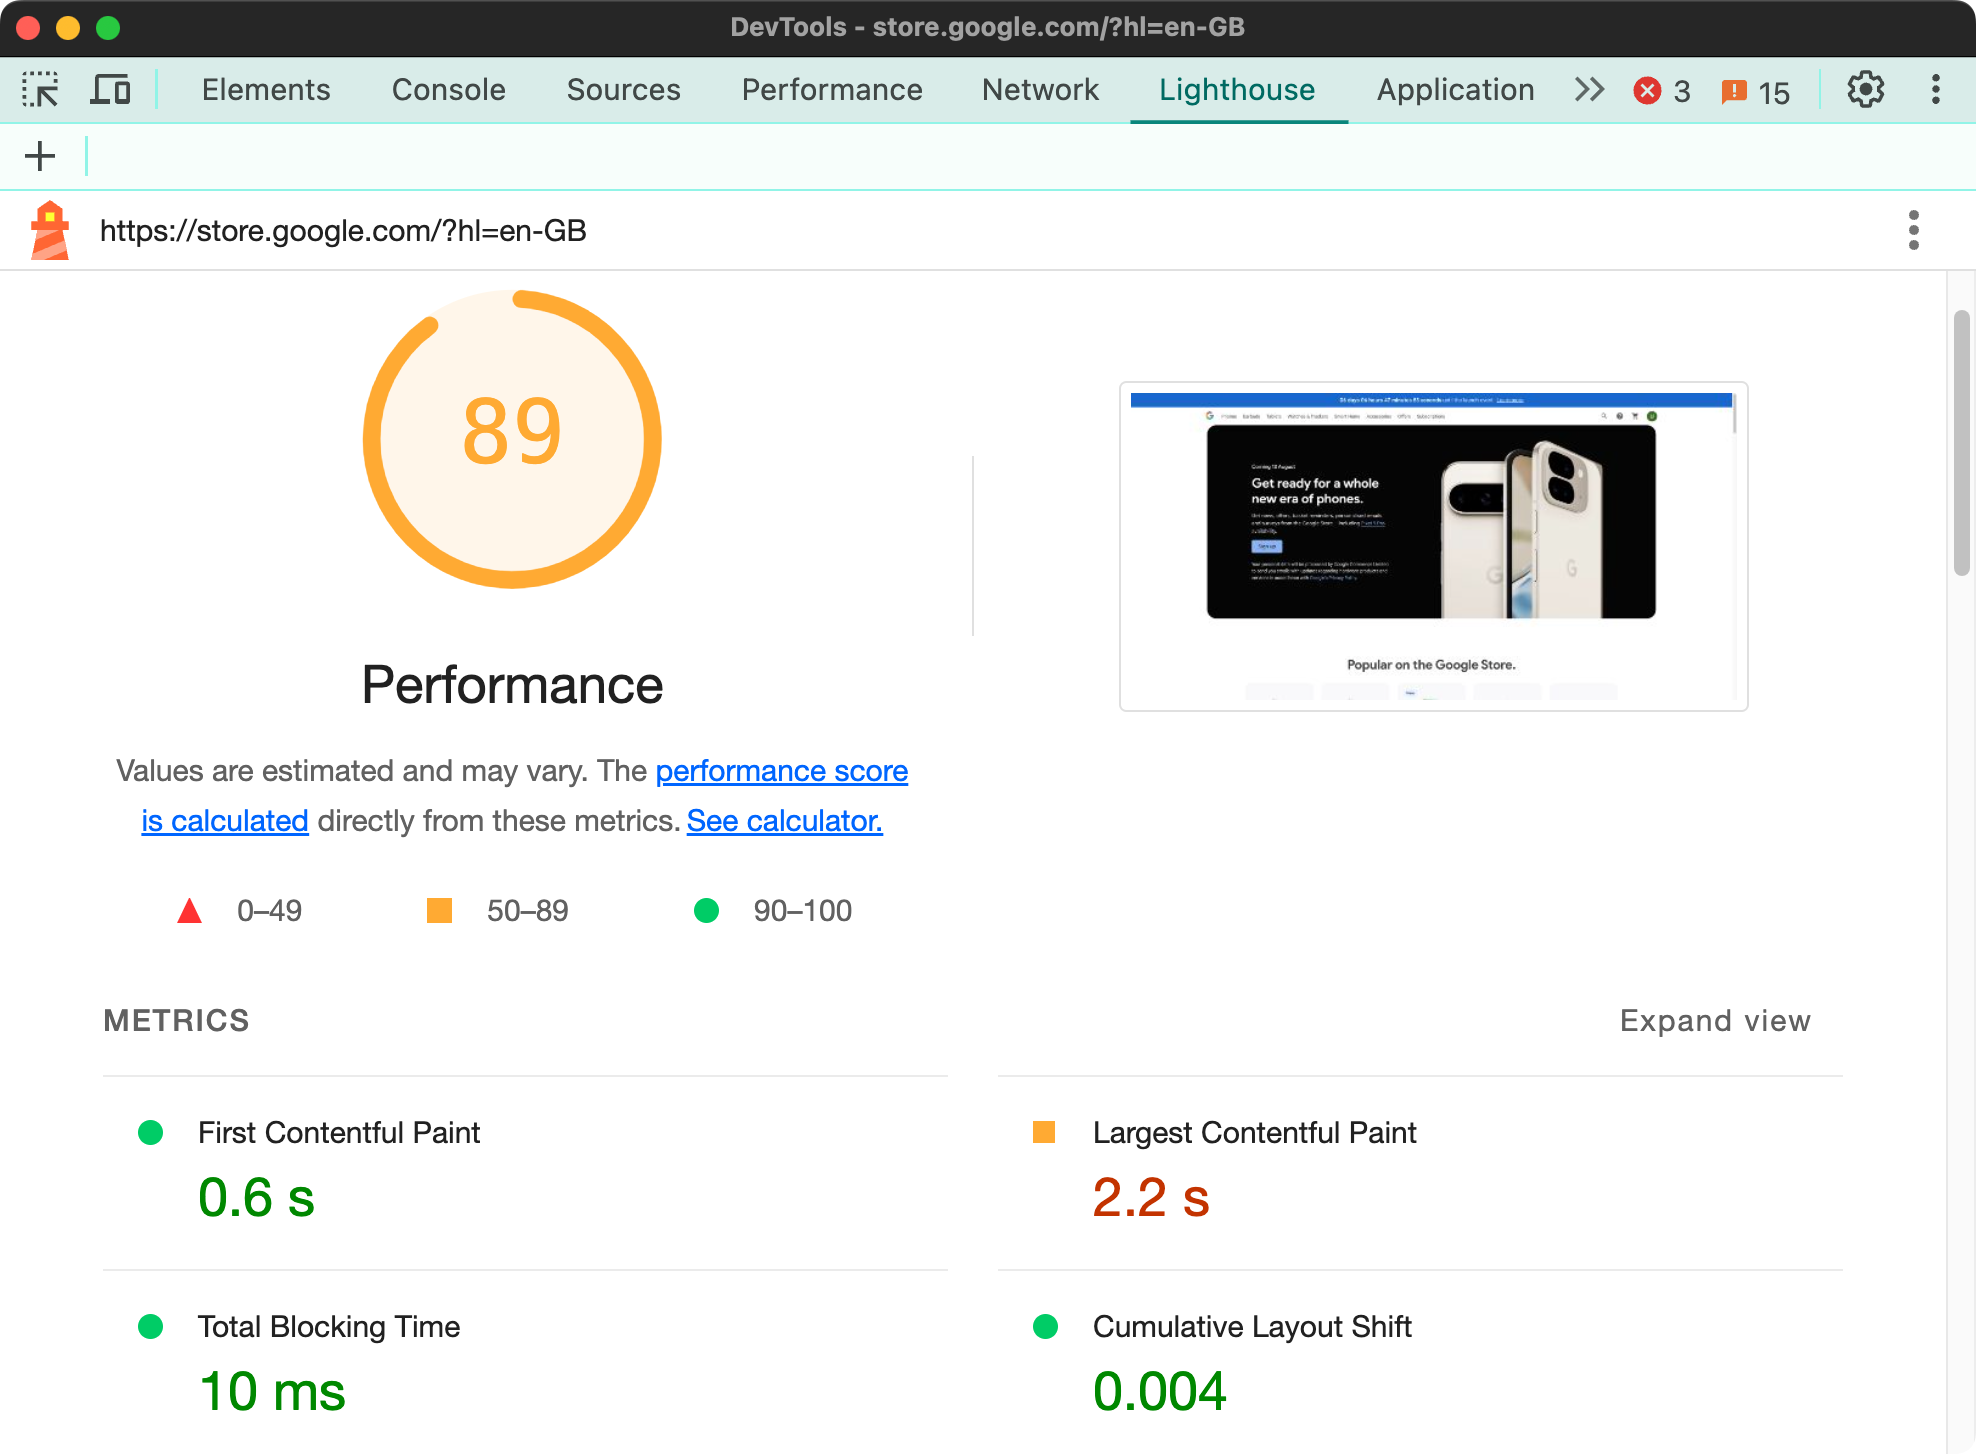
2. Understanding the Performance Report
The Lighthouse report is dense with information, but we'll focus on the most critical parts for your project's goals.
First, a quick note on the data itself. The Lighthouse report you just ran provides Lab Data. This is performance data collected in a controlled, simulated environment. It's excellent for debugging and testing changes during development. This contrasts with Field Data (also known as Real User Monitoring or RUM), which is collected from actual users in the real world. We'll touch on that later.
Optimizing Web Vitals using Lighthouse
To start, let's get a clear understanding of what Lighthouse is and how it measures the Core Web Vitals we've been discussing. This article from web.dev provides a great overview.
Please read the introduction and the section titled 'Measure Core Web Vitals'. Focus on how Lighthouse synthetically measures LCP, CLS, and TBT, and the distinction between lab and field data.
Core Web Vitals Metrics
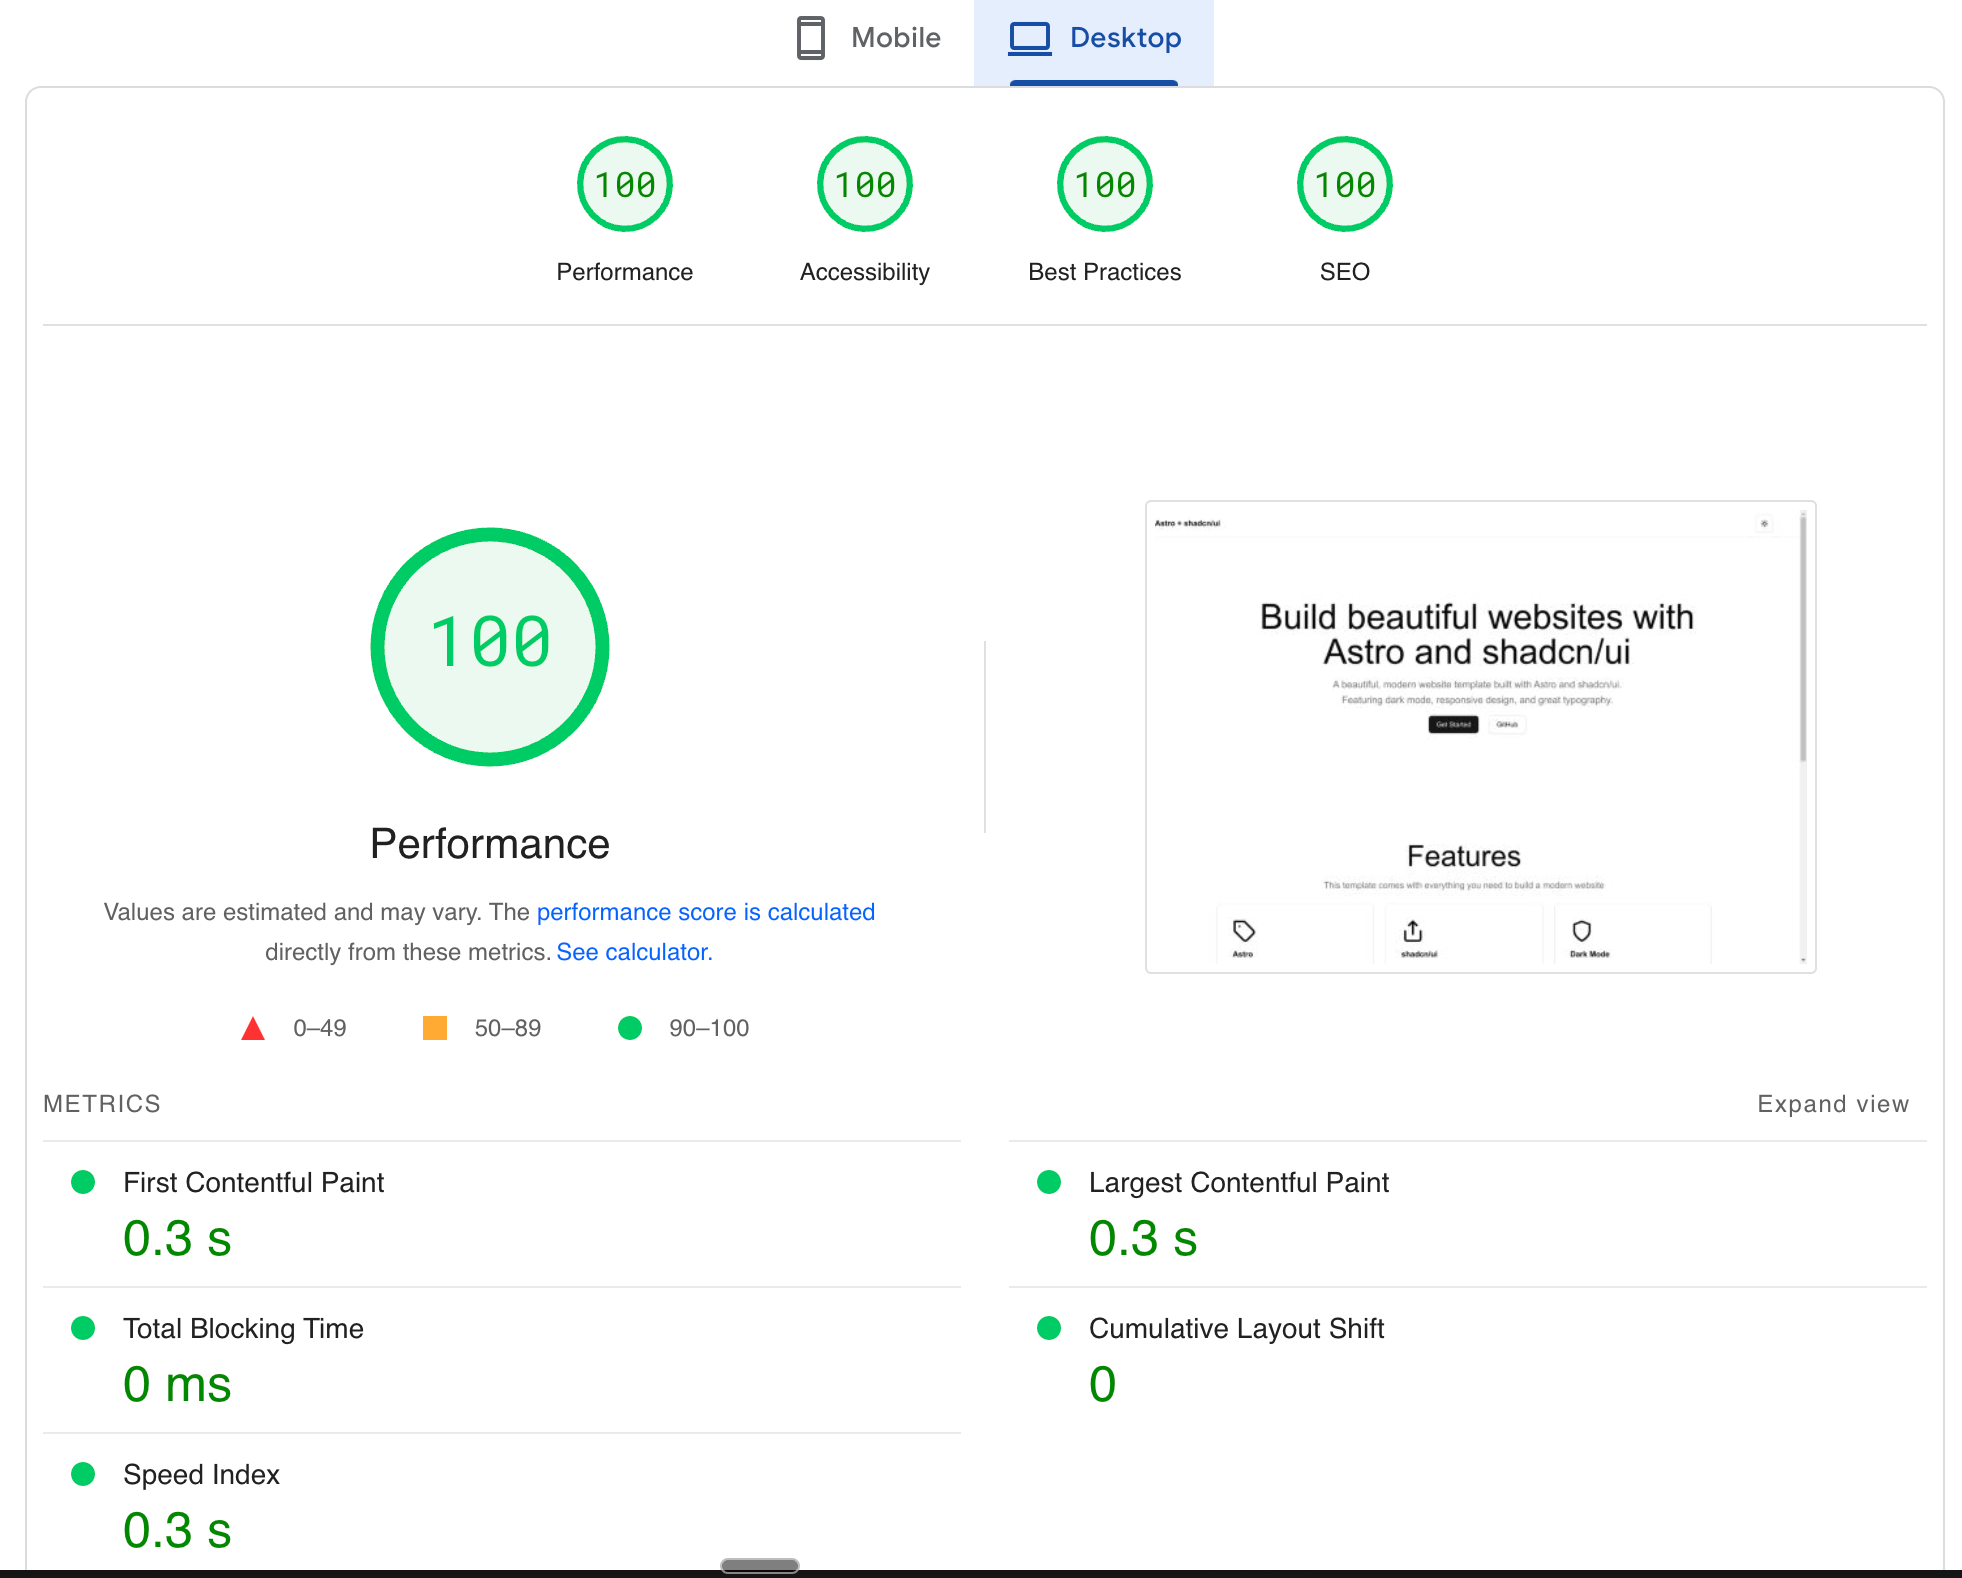
The Performance score is a weighted average of several metrics. The most important ones are the Core Web Vitals:
- Largest Contentful Paint (LCP): Measures loading performance. To provide a good user experience, LCP should occur within 2.5 seconds of when the page first starts loading.
- Cumulative Layout Shift (CLS): Measures visual stability. To provide a good user experience, pages should maintain a CLS of 0.1 or less.
- Total Blocking Time (TBT): Measures load responsiveness. TBT is a lab proxy for a newer field metric, Interaction to Next Paint (INP). A low TBT score (under 200ms is a good target) indicates the page is responsive to user input quickly.
These metrics directly reflect the user's experience and are a significant ranking factor for Google. Achieving excellent scores here is non-negotiable for a premium website.
Opportunities and Diagnostics
Below the metrics, Lighthouse provides two invaluable sections: Opportunities and Diagnostics. This is where Lighthouse stops being a grader and becomes a tutor. It gives you specific, actionable recommendations to improve your score.
Let's connect these recommendations to the optimizations you've already learned in this module:
- For LCP: Lighthouse might flag "Preload Largest Contentful Paint image" or "Largest Contentful Paint image was lazily loaded". This directly relates to our lesson on image optimization. The "Largest Contentful Paint element" audit will even tell you exactly which element is the LCP, so you know what to focus on.
- For CLS: If you see a poor CLS score, check the "Avoid large layout shifts" audit. It will list the specific DOM elements that shifted during page load. This is often caused by images without
widthandheightattributes or, as we saw in the last lesson, a "Flash of Unstyled Text" (FOUT) from font loading. - For TBT: A high TBT is usually caused by heavy JavaScript execution blocking the main thread. The "Avoid long main-thread tasks" audit will pinpoint the scripts responsible. Your work with client directives (
client:load,client:visible, etc.) is the primary way to solve this in Astro.
Optimizing Web Vitals using Lighthouse
Now, let's dive deeper into how to use Lighthouse to debug each of the Core Web Vitals. This article provides a practical walkthrough.
Please read the section 'Identify where you can improve on Web Vitals' and its subsections. Pay close attention to how specific audits map to LCP, CLS, and TBT/FID issues. You don't need to memorize every detail, but understand the process: see a bad metric -> find the corresponding audit -> identify the root cause.
Test your understanding!
You run a Lighthouse audit on your new homepage and get a poor LCP score. You look at the "Opportunities" section and see the recommendation "Preload Largest Contentful Paint image". The "Diagnostics" section identifies your hero banner image as the LCP element.
In our lesson on image optimization, we used the Astro <Image /> component. What property on the <Image /> component should you likely adjust to address this Lighthouse recommendation?
Show answer
You should likely adjust the loading property. The hero image is "above the fold" and critical for the initial view. Its loading property should be set to "eager" (which is the default, but it's good practice to be explicit for critical images), not "lazy". If Lighthouse flags the LCP image as being lazily loaded, it's a sign that you're incorrectly deferring the loading of your most important visual content.
3. A Professional Performance Monitoring Workflow
Running Lighthouse in DevTools is perfect for development, but a production-ready workflow requires a more robust strategy to ensure performance doesn't degrade over time. This involves a mix of automated checks and real-world data analysis.
Web Performance Optimization with Astro: A Deep Dive
This article outlines a fantastic three-tier monitoring approach that aligns perfectly with a professional development workflow. It will broaden your perspective from one-off audits to continuous performance monitoring.
Please read the sections 'Performance Monitoring: Catching Regressions Early' and 'Performance Monitoring Tools Deep Dive'. Focus on understanding the role of each tool: Lighthouse CI: For automated testing before deployment. PageSpeed Insights: For monitoring real user data in production. WebPageTest: For deep, diagnostic analysis.
Let's summarize that professional workflow:
-
Synthetic Monitoring (Pre-deployment) with Lighthouse CI: You can integrate Lighthouse into your Continuous Integration (CI) pipeline (e.g., using GitHub Actions). This automatically runs an audit on every pull request. You can even set "performance budgets" (e.g., "fail the build if the Performance score is below 90" or "JavaScript size exceeds 100KB"). This is your first line of defense against performance regressions.
-
Real User Monitoring (Production) with PageSpeed Insights: Once your site is live, PageSpeed Insights becomes your key tool. It provides both the "Lab Data" from Lighthouse and, once you have enough traffic, "Field Data" from the Chrome User Experience Report (CrUX). This field data shows how your site is actually performing for real users on various devices and networks. This is the ultimate source of truth.
-
Comprehensive Testing (As Needed) with WebPageTest: When you encounter a stubborn performance issue that Lighthouse can't fully explain, WebPageTest is your go-to tool. It provides incredibly detailed waterfall charts and filmstrip views to give you a forensic look at how your page loads.
By adopting this tiered approach, you not only launch a fast site but also ensure it stays that way, which is essential for maintaining the professional, trustworthy image of the accounting firm you're building for.
Conclusion
You now have the tools and knowledge to measure, analyze, and maintain a high-performance website. This lesson closes the loop on our performance module: you don't just know how to make a site fast; you know how to prove it and how to diagnose problems when they arise.
Key Takeaways:
- Lighthouse is an essential, built-in Chrome tool for auditing performance, accessibility, SEO, and best practices.
- The key performance metrics to focus on are the Core Web Vitals: Largest Contentful Paint (LCP), Cumulative Layout Shift (CLS), and Total Blocking Time (TBT) as a lab proxy for interactivity.
- The Opportunities and Diagnostics sections of a Lighthouse report provide specific, actionable advice to improve your scores.
- A professional workflow combines Lighthouse for development, Lighthouse CI for preventing regressions, and PageSpeed Insights for monitoring real user data.
Up Next:
This lesson concludes our module on Performance and Optimization. You've equipped your project with a foundation of speed and stability. Now, we'll build on that by adding more complex, user-facing features. In the first lesson of our next module, "Advanced Features: Search and Forms," you will learn how to build a contact form as an interactive React component with client-side validation.