Introduction
Welcome to your next lesson on elasticity. In our previous session, we focused on income elasticity, learning how to measure the responsiveness of quantity demanded to changes in consumer income and how to classify goods as normal or inferior. We established a clear pattern: define the concept, learn its formula, and interpret the result to classify goods.
Today, we will apply this same analytical pattern to a new question: How does a price change in one good affect the quantity demanded of another good? This lesson is designed to address the learning outcome: Define and calculate cross-price elasticity of demand and distinguish between substitutes and complements.
Understanding this relationship is crucial for an analyst. It helps in assessing a company's competitive position, predicting the impact of a rival's pricing strategy, and understanding how products in a portfolio interact. For the CFA exam, it's a fundamental concept that frequently appears in questions involving demand analysis.
1. Defining Cross-Price Elasticity: Substitutes vs. Complements
Cross-price elasticity of demand (often abbreviated as XED or ) measures the percentage change in the quantity demanded of one good (let's call it Good X) in response to a percentage change in the price of a related good (Good Y).
The formula is:
As with income elasticity, the sign of the result is the key to interpretation. It tells us whether the two goods are substitutes or complements.
Let's watch a video that introduces the concept and explains this critical distinction.
Y1 13) Cross Elasticity of Demand (XED)
This video from EconplusDal provides a clear and concise explanation of cross-price elasticity of demand (XED), its formula, and how its sign helps us identify substitutes and complements.
Please watch the video from the beginning until 02:05. Pay close attention to the formula and the logic behind why a positive sign indicates a substitute and a negative sign indicates a complement.
As the video explains, the relationship between the two goods is revealed by the sign of the cross-price elasticity:
-
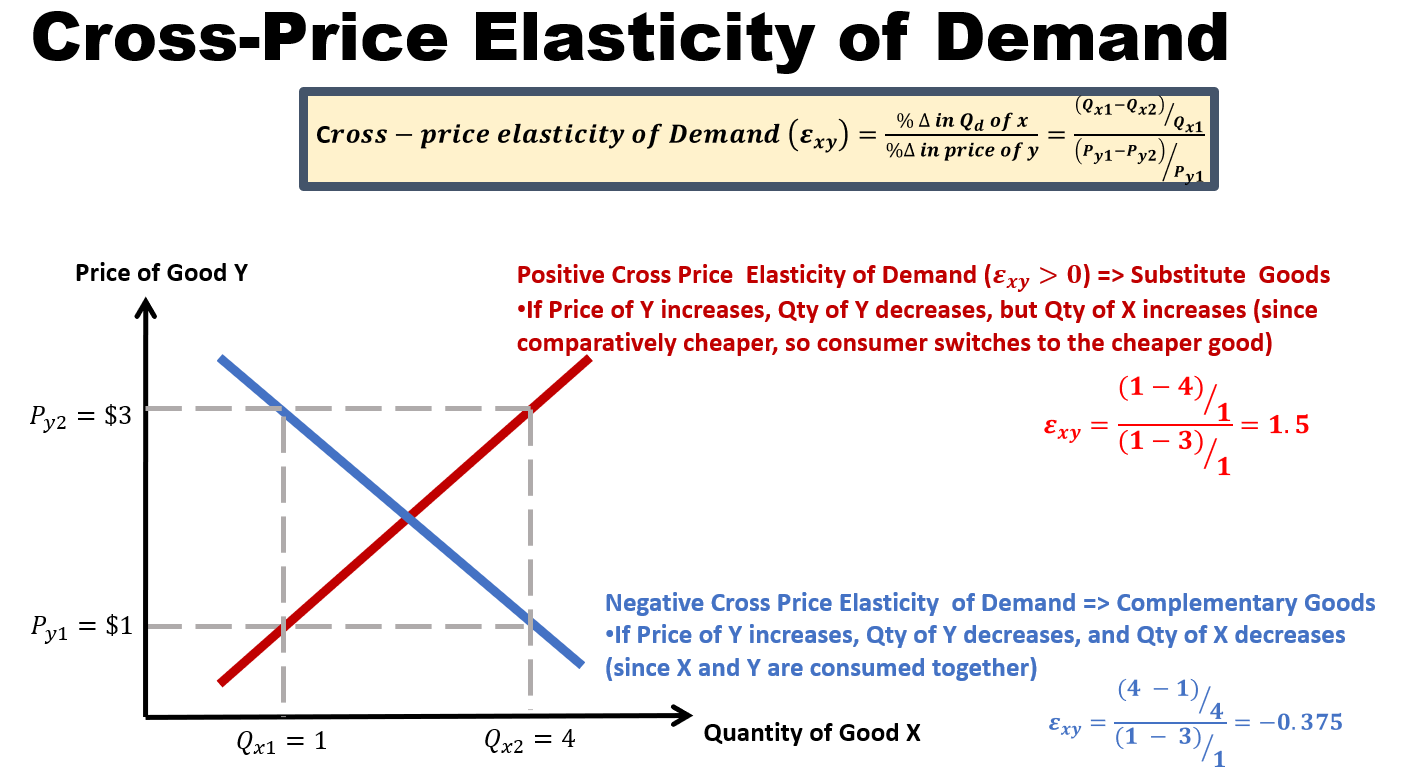
Substitutes (): The cross-price elasticity is positive. This means that as the price of Good Y increases, the quantity demanded of Good X also increases. This makes intuitive sense: if the price of Coca-Cola (Good Y) goes up, consumers will switch to a cheaper alternative, increasing the demand for Pepsi (Good X).
-
Complements (): The cross-price elasticity is negative. This indicates that as the price of Good Y increases, the quantity demanded of Good X decreases. These are goods that are typically consumed together. For example, if the price of printers (Good Y) rises, fewer people will buy them, and consequently, the demand for printer ink cartridges (Good X) will fall.
-
Unrelated Goods (): If the cross-price elasticity is zero, a change in the price of Good Y has no impact on the quantity demanded of Good X. For example, a change in the price of gasoline is unlikely to affect the demand for milk.
The following image provides a great visual summary of these rules and the associated formulas.
2. Calculating Cross-Price Elasticity of Demand
For your CFA exam, you will need to calculate cross-price elasticity, often from a given demand function. This process is very similar to what we did in the last lesson with income elasticity.
We use the point elasticity formula:
In a linear demand function, such as , the term is simply the coefficient of the price of the related good, , which in this case is c.
Let's walk through a comprehensive example that mirrors the style of questions you'll encounter.
Topics in Demand and Supply Analysis - IFT World
This resource from IFT World provides an excellent, exam-style practice problem. It will show you how to calculate cross-price elasticity from a demand function for multiple related goods.
Read the section titled 'Example', starting with the consumer's weekly demand function for coffee. Follow the step-by-step solution, paying specific attention to parts 3 through 6, which deal with cross-price elasticity.
Let's break down the logic from the IFT example to ensure it's crystal clear.
Given:
- Demand function for coffee (Good A):
- Prices and Income: , (tea), (lemon water),
Step 1: Calculate the initial quantity demanded ().
As always, the first step is to find the current quantity demanded by substituting the given values into the function.
Step 2: Calculate the cross-price elasticity for each related good.
A. Coffee (A) and Tea (B):
- The coefficient for is +0.10.
- Using the point elasticity formula:
- Interpretation: The sign is positive, so coffee and tea are substitutes.
B. Coffee (A) and Lemon Water (C):
- The coefficient for is -0.15.
- Using the point elasticity formula:
- Interpretation: The sign is negative, so coffee and lemon water are complements.
This example perfectly demonstrates the process: find the quantity, identify the correct coefficient, plug the values into the formula, and interpret the sign.
3. A Practical Application: Analyzing a Business Case
Your preference for practical application is key to mastering these concepts. Let's analyze another scenario that illustrates how a firm like McDonald's might use cross-price elasticity.
Cross Price and Income Elasticity of Demand - PrepNuggets
The following resource from PrepNuggets uses the familiar example of a McDonald's Big Mac to calculate cross-price elasticity against both a substitute (Burger King's Whopper) and a complement (McDonald's French fries).
Read the section titled 'Understanding Elasticity: A McDonald’s Example'. Focus on how the cross-price elasticities for the Whopper and for French fries are calculated and what they imply about the relationship between the products.
Let's review the calculations from the PrepNuggets article:
Given:
- Demand function for Big Macs:
- Values: , , ,
- Calculated Quantity:
Calculation for the Whopper (a substitute):
- Coefficient of is +1.5.
- The positive sign confirms that Big Macs and Whoppers are substitutes. A 1% increase in the price of a Whopper leads to a 0.375% increase in the quantity of Big Macs demanded.
Calculation for French Fries (a complement):
- Coefficient of is -0.5.
- The negative sign confirms that Big Macs and French fries are complements. A 1% increase in the price of fries leads to a 0.0625% decrease in the quantity of Big Macs demanded.
This practical example reinforces how a single demand function can provide a wealth of information about a product's relationship with its competitors and its own complementary products.
Conclusion
In this lesson, we completed our exploration of the different types of demand elasticity. We defined cross-price elasticity, saw how to calculate it, and, most importantly, learned how to use its sign to distinguish between substitute and complementary goods.
Key Takeaways:
- Cross-Price Elasticity of Demand () measures the responsiveness of the quantity demanded of Good X to a price change in Good Y.
- The sign of is the crucial indicator of the relationship:
- : The goods are substitutes.
- : The goods are complements.
- : The goods are unrelated.
- The calculation follows the point elasticity formula, , where the first term is the coefficient from the demand function.
Preview of the Next Lesson:
Having thoroughly examined elasticity from the consumer's perspective (demand), we will now shift our focus to the producer's side of the market. In the next lesson, we will define and calculate the price elasticity of supply, exploring what factors make a producer more or less responsive to changes in market price.