Introduction
Welcome to the final lesson in our study of market structures. Over the past few lessons, we've taken a detailed look at the four major market types: perfect competition, monopolistic competition, oligopoly, and monopoly. We've explored their individual characteristics and the strategic behavior of firms within them, culminating in our recent look at the game theory behind oligopoly pricing.
Now it's time to bring all of these concepts together. This lesson directly addresses a crucial learning outcome for the CFA exam: comparing the price, output, and efficiency of all four market structures. We will systematically evaluate how each structure performs on these key metrics, providing you with a clear, consolidated framework for analysis. Understanding these trade-offs is essential, as it represents the culmination of everything we've learned about the firm and its operating environment.
1. A Framework for Comparison
To effectively compare the four market structures, we need a consistent set of criteria. We'll organize our analysis around the following key characteristics and outcomes:
- Number of Firms and Barriers to Entry: The level of competition in a market.
- Pricing Power: A firm's ability to set prices above marginal cost.
- Output Level: How much the industry produces relative to the socially efficient quantity.
- Long-Run Profitability: The potential for firms to earn economic profits over time.
- Efficiency: How well the market allocates resources, which we'll break down into two types.
This PDF from Edge Designations provides an excellent, concise table that summarizes these points. It will serve as our foundational reference for this lesson.
[PDF] Introduction to the Firm and Market Organization
Let's start by studying a comparative table. This document clearly lays out the defining features of each market structure side-by-side.
Please read the table on the second page of the document (page 2 of the PDF). Focus on the columns for 'Number of firms,' 'Nature of product,' 'Entry,' 'Firm’s control over price,' and 'Long-run economic profit.'
As you can see from the reading, the market structures exist on a spectrum of competition:
- Perfect Competition: The most competitive, with many firms and no barriers to entry.
- Monopoly: The least competitive, with a single firm protected by high barriers to entry.
- Monopolistic Competition & Oligopoly: These are intermediate structures. Monopolistic competition has many firms but differentiated products, while oligopoly has few firms whose strategic decisions are interdependent.
This structure dictates all the outcomes we are about to discuss.
2. Comparing Price, Output, and Profitability
Now let's analyze how the characteristics of each market translate into tangible outcomes for price, output, and long-run profit.
A key rule to remember across all market structures is that firms maximize profit by producing at the quantity where Marginal Revenue (MR) equals Marginal Cost (MC). The crucial difference lies in how Price (P) relates to MR and MC in each market.
The following image provides a fantastic visual summary of these relationships.
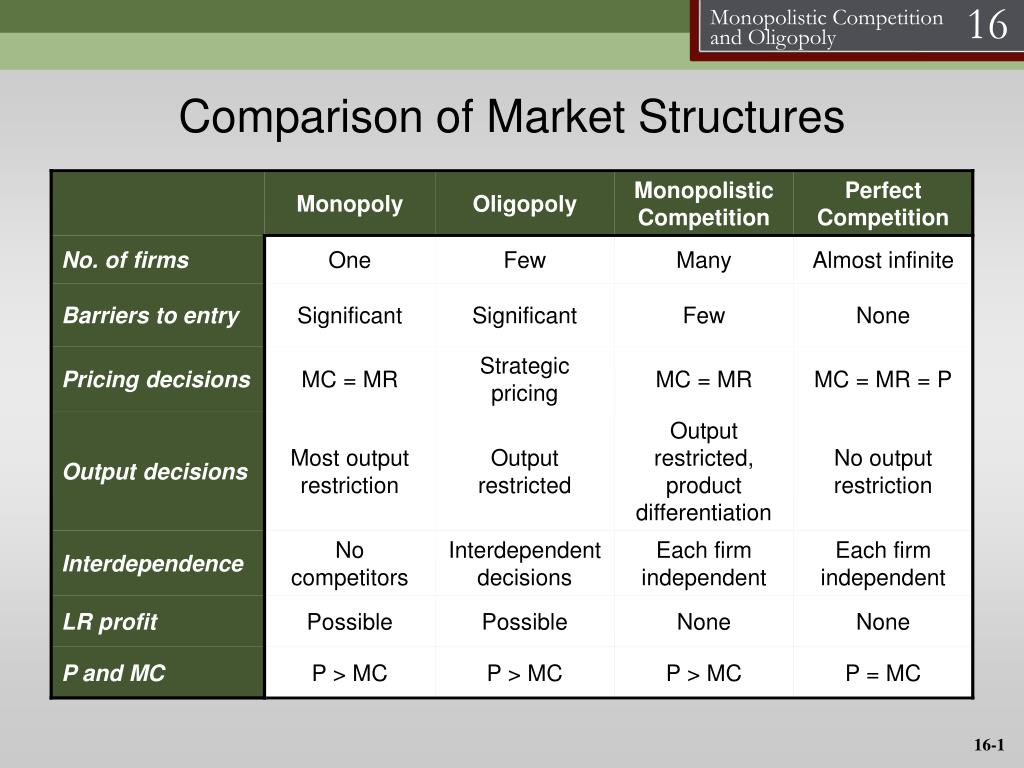
Let's break down the information in this table:
| Feature | Perfect Competition | Monopolistic Competition | Oligopoly | Monopoly |
|---|---|---|---|---|
| Price | Lowest | Intermediate | Intermediate to High | Highest |
| Output | Highest | Intermediate | Intermediate to Low | Lowest |
| Price vs. MC | P = MC |
P > MC |
P > MC |
P > MC |
| Long-Run Profit | Zero Economic Profit | Zero Economic Profit | Potential for Economic Profit | Potential for Economic Profit |
Key Insights:
- Perfect Competition: Firms are price takers, so the price is determined by the market. They have no power to charge more. In the long run,
P = MC = Minimum ATC, meaning they produce the efficient quantity and earn only a normal profit (zero economic profit). - Monopoly: As the sole producer, the monopolist has the most significant pricing power. It restricts output to the level where
MR = MCand charges the highest price the market will bear, leading to the lowest output and highest price among all structures. High barriers to entry allow it to sustain long-run economic profits. - Monopolistic Competition: Product differentiation gives firms some pricing power, so
P > MC. However, low barriers to entry mean that any short-run economic profits are competed away. In the long run, new firms enter, driving the price down untilP = ATCand economic profit is zero. - Oligopoly: The outcomes for price and output are strategic and depend on the degree of cooperation. If firms collude, they can act like a monopoly, leading to high prices and low output. If they compete aggressively, outcomes can move closer to those of perfect competition. Barriers to entry make long-run economic profits possible.
This video provides a great summary of the characteristics and outcomes for each market type.
Level I CFA: Economics: The Firm and Market Structures-Lecture 5
To reinforce these points, let's watch a video summary that walks through each market structure, highlighting their key features and long-run equilibrium outcomes.
Watch the segment from 08:23 to 16:41. The speaker provides a concise review of perfect competition, monopolistic competition, oligopoly, and monopoly, which will help consolidate your understanding.
3. The Crucial Comparison: Economic Efficiency
For the CFA exam, it's not enough to know the price and output levels; you must also evaluate the efficiency of these outcomes. We measure efficiency in two ways:
-
Allocative Efficiency: Is the market producing the "right" amount of a good? This occurs when the value consumers place on the last unit (the Price) is equal to the cost of the resources used to produce it (the Marginal Cost).
- Condition:
P = MC. - When this holds, total surplus (the sum of consumer and producer surplus) is maximized. Any deviation creates a deadweight loss.
- Condition:
-
Productive Efficiency: Is the market producing at the lowest possible cost? This occurs when firms produce at the minimum point of their Average Total Cost (ATC) curve.
Let's see how each market stacks up.
Perfect Competition: The Benchmark for Efficiency
In the long run, a perfectly competitive market achieves both allocative efficiency (P = MC) and productive efficiency (production at minimum ATC). It maximizes total surplus and is therefore considered the most efficient market structure.
Monopoly: The Benchmark for Inefficiency
A monopoly is inefficient on both counts.
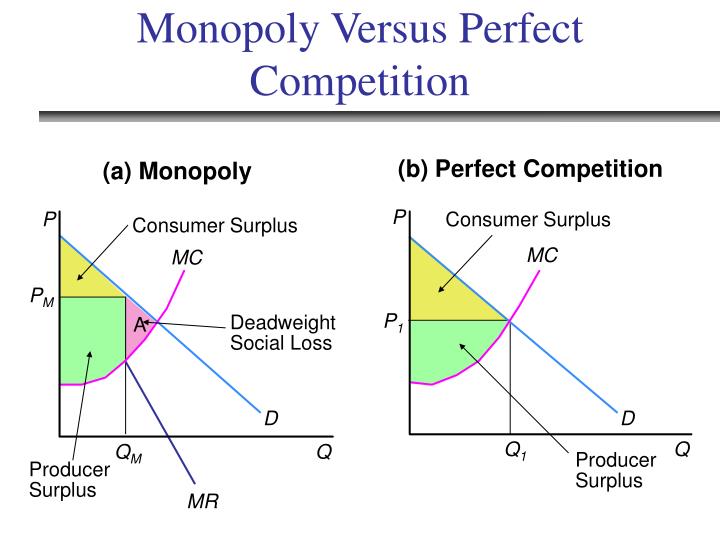
- It restricts output and sets
P > MC, violating allocative efficiency. This creates a significant deadweight loss, representing value that is lost to society. - It does not operate at the minimum of its ATC curve, meaning it is also productively inefficient.
This image clearly illustrates the deadweight loss caused by a monopoly compared to perfect competition.
Monopolistic Competition and Oligopoly: The Middle Ground
Both of these market structures are inefficient compared to perfect competition.
-
Monopolistic Competition:
- Allocative Inefficiency: Firms use their market power from product differentiation to set
P > MC. - Productive Inefficiency: In the long run, firms operate with excess capacity. They produce at a quantity where ATC is still falling, not at the minimum point of the ATC curve. This inefficiency is often considered the social "cost" of product variety and consumer choice.
- Allocative Inefficiency: Firms use their market power from product differentiation to set
-
Oligopoly:
- Allocative Inefficiency: Firms collude or tacitly cooperate to keep
P > MC. - Productive Inefficiency: Like monopolists, they do not typically produce at the minimum of the ATC curve. The level of inefficiency depends on the intensity of competition.
- Allocative Inefficiency: Firms collude or tacitly cooperate to keep
The following reading provides a concise discussion on the defects of markets with high entry barriers (monopoly and oligopoly), reinforcing why they lead to inefficient outcomes.
[PDF] 5. Market Structures - CFA Exam Prep
To understand the source of inefficiency, let's look at this explanation of markets with high entry barriers.
Read the section titled 'Defects in Markets with High Entry Barriers' on page 82. This will clarify how reduced competition leads to allocative inefficiency.
Conclusion
We have now systematically compared the four market structures, moving from their basic characteristics to their ultimate impact on price, output, and societal welfare. This comparative framework is a high-yield topic for the CFA exam.
Key Takeaways:
- Spectrum of Competition: Market structures range from the highly competitive (perfect competition) to the non-competitive (monopoly), with monopolistic competition and oligopoly in between.
- Price and Output: As market power increases (moving from perfect competition to monopoly), price tends to rise, and output quantity tends to fall.
- Profitability: Only firms in markets with high barriers to entry (monopoly and oligopoly) can sustain long-run economic profits.
- Efficiency: Perfect competition is the only market structure that is both allocatively (
P = MC) and productively (production at min ATC) efficient in the long run. All other structures lead to a deadweight loss, with monopoly being the least efficient. - Trade-offs: Monopolistic competition, while inefficient, offers the benefit of product variety. Oligopoly outcomes are variable and depend on the degree of strategic interaction and collusion.
Preview of the Next Lesson:
This lesson concludes our study of microeconomics. We have built a strong foundation from the principles of demand and supply to the complex behaviors of firms in different markets. In our next module, we will shift our perspective significantly, moving from the analysis of individual firms and markets to the study of the economy as a whole. We will begin our exploration of macroeconomics by learning how to measure the overall health and output of an economy with the concept of Gross Domestic Product (GDP).