Introduction
Welcome back! In our last lesson, we established a crucial concept for monopolistic competition: because of product differentiation, each firm faces its own downward-sloping demand curve. This gives the firm some pricing power, and it means its marginal revenue (MR) curve lies below its demand curve.
Today, we'll build directly on that foundation to address a core question for your CFA exam preparation. Our learning outcome is to determine the short-run profit-maximizing output and price for a firm in monopolistic competition. We will combine the revenue concepts from our last lesson with a firm's cost structure to find the exact point of maximum profit. This involves a two-step process that is fundamental to understanding firm behavior in any market that isn't perfectly competitive.
1. The Universal Rule of Profit Maximization
For any firm looking to maximize its profit, from a local restaurant to a global software company, the decision-making process boils down to a single, powerful rule: produce up to the point where marginal revenue equals marginal cost (MR = MC).
Let's break down the logic:
- If a firm produces a unit where MR > MC, that unit adds more to revenue than it adds to cost. Producing it increases total profit. The firm should produce it and continue producing more.
- If a firm produces a unit where MR < MC, that unit adds more to cost than it adds to revenue. Producing it decreases total profit. The firm should not have produced it and should reduce its output.
- Therefore, the optimal, profit-maximizing quantity is exactly where MR = MC.
This principle is the cornerstone of our analysis today. A fantastic resource from Lumen Learning walks through this logic in a clear, step-by-step manner and provides a numerical example to make it tangible.
Profit Maximization under Monopolistic Competition
This resource, titled 'Profit Maximization under Monopolistic Competition,' clearly explains the process a firm uses to find its optimal output and price.
Please read two parts of this page: First, review the introductory text and 'Table 1. Revenue and Cost Schedule' to see how the data for a firm is laid out. Then, read the section 'How a Monopolistic Competitor Determines How Much to Produce and at What Price' which details the two-step process. Focus on the logic of comparing MR to MC to find the profit-maximizing quantity.
As you saw in the reading and its 'Authentic Chinese Pizza' example, the process is methodical:
- Find the profit-maximizing quantity: Look for the output level where MR = MC. In their
Table 1, this occurs at a quantity of 40 units, where both MR and MC are $10. - Find the price: Once you know the quantity, look at the demand curve (or the 'Price' column in the table) to see what price consumers are willing to pay for that quantity. For 40 units, the price is $16.
This two-step process—first quantity, then price—is essential. A common mistake is to look for the price where MR=MC, but the price is always determined by what the market (the demand curve) will bear.
2. Graphical Analysis of Short-Run Profit Maximization
Now, let's visualize this process on the standard economic graph. The graph is the most common way this concept is tested on the CFA exam.
The process on the graph mirrors the steps we just discussed:
- Find Quantity (Q*): Locate the intersection of the Marginal Revenue (MR) and Marginal Cost (MC) curves.
- Find Price (P*): From that intersection point, draw a vertical line up to the Demand (D) curve. The corresponding point on the vertical price axis is the profit-maximizing price.
The following video provides an excellent animated walkthrough of this process.
Y2 23) Monopolistic Competition
The video 'Monopolistic Competition' by EconplusDal clearly illustrates how to find the profit-maximizing price and quantity on a graph.
Watch the segment from 01:49 to 03:54. Pay close attention to how the presenter first finds the quantity where MR=MC, and then moves up to the demand curve to determine the price.
To reinforce this, let's watch another short clip that shows the exact same graphical logic, which will help solidify your understanding.
The Firm and Market Structures (2024/2025 CFA® Level I Exam – Economics – Learning Module 1)
This clip from the AnalystPrep video 'The Firm and Market Structures' also demonstrates the graphical determination of price and output, confirming the two-step rule.
Watch from 31:39 to 33:04. Notice how the analysis identifies the MR=MC intersection to find quantity, then goes up to the demand curve for price, and identifies the resulting profit area.
Both videos show the same thing: the firm chooses quantity based on its marginal cost and marginal revenue, but it charges the price consumers are willing to pay, as shown by the demand curve.
3. Calculating Economic Profit (and Loss)
Once we have the profit-maximizing price (P*) and quantity (Q*), we can determine the firm's economic profit.
The formula for profit is:
Economic Profit = Total Revenue (TR) - Total Cost (TC)
Where:
- TR = P* × Q*
- TC = Average Total Cost (ATC) at Q* × Q*
This can be simplified to:
Economic Profit = (P* - ATC) × Q*
Graphically, this is the area of a rectangle:
- The height is the difference between the price and the average total cost at the optimal quantity (P* - ATC).
- The width is the optimal quantity (Q*).
The following resource provides a detailed guide on this calculation, complete with another numerical table and graph.
Profit Maximization under Monopolistic Competition
Let's return to the 'Profit Maximization under Monopolistic Competition' resource to see how profit is calculated.
Please read the section titled 'Calculating Profits'. Focus on how 'Table 2' and 'Figure 2' are used to find Total Revenue, Total Cost, and the resulting economic profit.
Short-Run Profits vs. Short-Run Losses
It is crucial to remember that we are in the short run. This means a firm can earn a positive economic profit (as in the examples so far), break even (P* = ATC), or even incur a loss (P* < ATC). The MR=MC rule still holds even if the firm is losing money, as it tells the firm how to minimize its loss.
The following image perfectly illustrates the two possibilities: a firm making a profit and a firm making a loss.
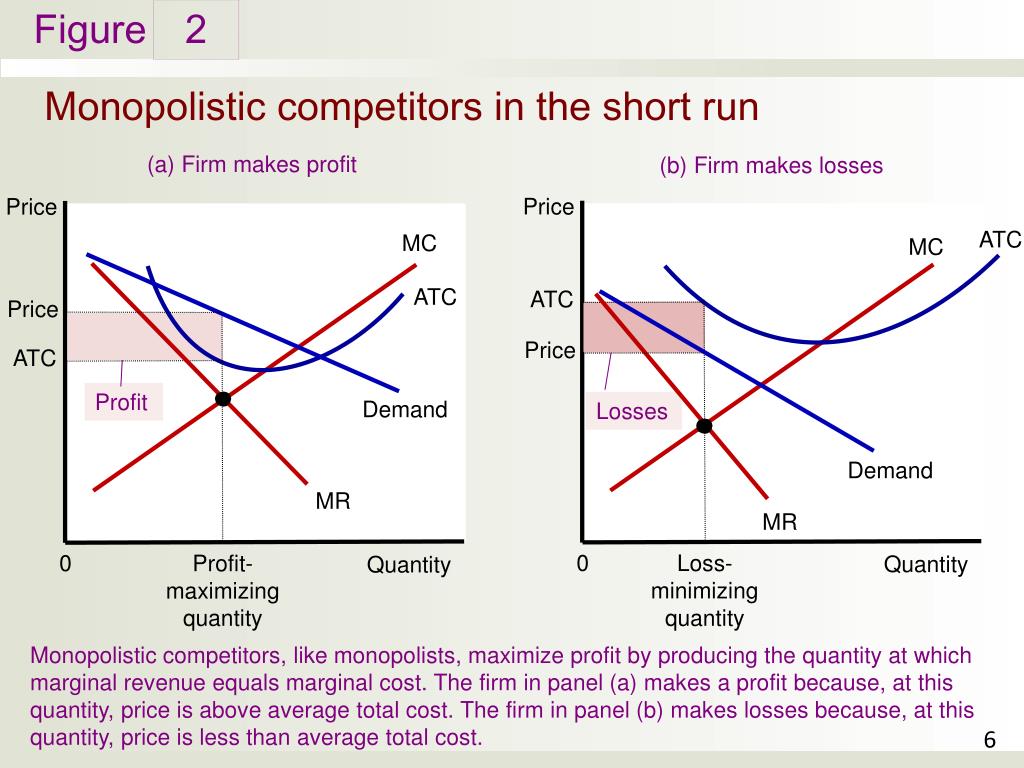
Whether the firm chooses to continue operating while making a loss, or shut down, depends on whether the price covers its average variable costs—a topic we will explore more deeply in a future lesson. For now, the key is to recognize that all three outcomes (profit, loss, break-even) are possible in the short run.
4. Practice Question
Let's test your understanding with a CFA-style question.
Monopolistic Competition | CFA Level 1 - AnalystPrep
The following question is from the AnalystPrep article on Monopolistic Competition.
Please read and answer the multiple-choice question at the end of the article.
Click to view the question and solution
Question:
A firm that is operating under a monopolistic competition maximizes its profits when:
- The average cost is minimized.
- Marginal revenue equals average cost.
- Marginal revenue equals marginal cost.
Solution:
The correct answer is 3.
A firm maximizes its profit by producing the quantity of output where marginal revenue equals marginal cost (MR=MC). Options 1 and 2 describe other points on the graph, but not the point of maximum profit.
Conclusion
In this lesson, we have combined the revenue and cost sides of a firm in monopolistic competition to determine its short-run profit-maximizing strategy. This is a critical skill for the CFA exam and for understanding business decision-making.
Key Takeaways:
- The profit-maximization rule for a firm in monopolistic competition is to produce the quantity where Marginal Revenue = Marginal Cost (MR=MC).
- The quantity is determined by the intersection of the MR and MC curves.
- The price is determined by moving vertically from that quantity up to the demand curve.
- Economic profit is calculated as (Price - Average Total Cost) × Quantity.
- In the short run, a firm in monopolistic competition can earn a positive economic profit, a loss, or break even.
Preview of the Next Lesson:
We've seen that firms in monopolistic competition can earn profits in the short run. However, unlike a monopoly, this market structure has low barriers to entry. What happens when new firms, attracted by these profits, enter the market? In our next lesson, we will explore the long-run equilibrium in monopolistic competition, where we'll see how competition erodes these short-run profits.