Welcome back! In our previous lesson, we established the four fundamental ways to represent a function: verbally, numerically, graphically, and algebraically. You learned how to identify and describe these representations, which form the bedrock of our communication in calculus.
Today, we'll take the next logical step. We will focus on how to interpret these representations to extract meaningful information about the relationship a function models. This is where the true power of functions begins to emerge. Instead of just seeing a graph or an equation, you'll learn to read its story—to understand its domain and range, identify its key features, and connect them to real-world or mathematical contexts. This skill is the essence of mathematical modeling, the process of translating real-world problems into a mathematical form that we can analyze and solve.
The Process of Mathematical Modeling
Before we dive into specifics, it's helpful to have a high-level view of what we're trying to accomplish. Mathematical modeling is the bridge between a "real-world system" and the abstract world of mathematics, or "Mathland," as the diagram below humorously calls it.
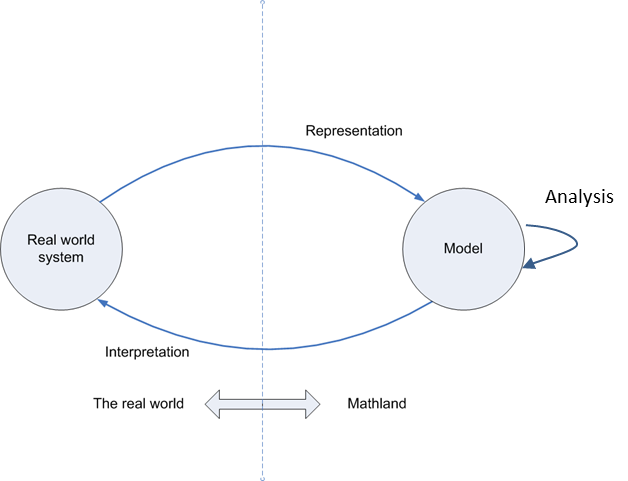
The process generally follows these steps:
- Representation (Formulation): We start with a real-world problem (e.g., the cost of manufacturing a product, the trajectory of a satellite). Our first task is to translate this into a mathematical model, often a function. This involves identifying variables, making simplifying assumptions, and establishing relationships.
- Analysis (Solving): Once we have a model (like an equation or a graph), we use mathematical tools—including the calculus techniques you will learn in this course—to analyze it and derive conclusions.
- Interpretation: We translate our mathematical conclusions back into the context of the original real-world problem, offering explanations or making predictions.
- Testing: Finally, we test our predictions against real data. If the model is inaccurate, we refine it and repeat the cycle.
In your IT background, particularly in network engineering, you engage in a similar process. You might model network traffic with queuing theory (a mathematical model) to predict latency under load (analysis and interpretation) and then compare those predictions to live network performance (testing). This lesson focuses on the crucial first and third steps: creating representations and interpreting the information they hold.
To get a more formal description of this process, please read the introductory section on mathematical modeling from your textbook's author.
This excerpt from a calculus text formally introduces the process of mathematical modeling.
In the section titled "MATHEMATICAL MODELING" (which begins section 1.2), please read from the start, where the process is outlined. Pay attention to the distinction between the real-world phenomenon and its idealized mathematical representation.
Extracting Information from a Function's Graph
A graph is often the most intuitive representation, providing an immediate "life history" of the function. Let's explore what a graph can tell us.
A graph allows us to visually determine:
- Function values: For any input , we can find the output (and vice versa).
- Domain and Range: The full extent of all possible inputs (-values) and outputs (-values).
- Key points like intercepts: Where the function crosses the axes. A -intercept often represents an initial state or value at time zero. An -intercept can represent a break-even point or a time when the quantity is zero.
- Behavior (Increasing/Decreasing): We can see where the function is rising, falling, or constant. This tells us about the rate of change of the quantity being modeled.
- Extrema (Maximums/Minimums): We can identify the highest or lowest points, which could represent a peak value, a minimum cost, or an optimal condition.
The following video provides an excellent walkthrough of how to read all of this information directly from a graph.
Functions and Graphs | Precalculus
This video, "Functions and Graphs," from The Organic Chemistry Tutor, demonstrates how to interpret key features from a function's graph.
Please watch the following segments: Finding f(x) and x: This reviews how to find output values from inputs and vice versa. Increasing and Decreasing: Pay close attention to how intervals are described using x-values. Relative Extrema: Learn the distinction between the location of a minimum/maximum (the x-coordinate) and its value (the y-coordinate). Domain and Range: This shows how to determine the domain and range using interval notation.
Extracting Information from an Algebraic Formula
An algebraic formula, like , is the most precise representation. It allows for exact calculations and deeper analysis.
From a formula, we can determine:
- Exact values: We can evaluate the function for any valid input to get a precise output.
- The Domain: We can find the domain by identifying values of the input variable that would lead to mathematical impossibilities, such as division by zero or taking the square root of a negative number. This is analogous to input validation in programming, ensuring the function doesn't "crash."
- The underlying relationship type: Recognizing the form of the equation—linear, quadratic, exponential, rational—tells us a great deal about the relationship it models. For example:
- A linear model () describes a relationship with a constant rate of change ().
- A polynomial model () can describe more complex curves with various peaks and valleys.
- An exponential model () describes phenomena where the rate of growth or decay is proportional to the current amount, like population growth or radioactive decay.
Let's watch a short video segment on how to determine the domain of a function from its algebraic formula by looking for these kinds of restrictions.
Calculus 1.1 Four Ways to Represent a Function
Let's return to the "Calculus 1.1" video by Asher Roberts.
Watch the segment from this timestamp, where he demonstrates how to find the domain for a function involving a square root and for a rational function (a fraction with variables in the denominator).
Extracting Information from Verbal and Numerical Representations
Often, real-world problems begin with a verbal description or a numerical table of data collected from an experiment.
- From a table of values, we can find specific input-output pairs and observe overall trends (e.g., "as time increases, temperature decreases"). We can also calculate the average rate of change between points, a concept that will lead us directly to the derivative.
- From a verbal description, our primary job is to identify the independent and dependent variables and translate the described relationships and constraints into a mathematical formula.
This translation from a verbal description to an algebraic model is one of the most important skills in applied mathematics. The following example is a masterclass in this process. It takes a description of a real-world object and its costs and methodically builds a cost function. This aligns perfectly with your preference for seeing model-building as a distinct step.
Calculus 1.1 Four Ways to Represent a Function
In this segment, Asher Roberts works through a complete modeling problem.
Please watch carefully from the storage container example. Observe the steps he takes: Draws a diagram to visualize the problem. Assigns variables to the unknown quantities (width w, height h). Writes down expressions for the quantities described verbally (area of base, area of sides). Builds an initial cost equation that involves both w and h. Uses a constraint from the problem (the fixed volume) to eliminate one variable (h), resulting in a final function for cost that depends only on the width, C(w).
This example beautifully encapsulates the first step of the modeling cycle: taking a real-world scenario and representing it with a function. The next step in a full optimization problem would be to use calculus to analyze and find the width that minimizes the cost.
From Model to Interpretation: Piecewise Functions
Sometimes, a single formula isn't enough to model a situation. A piecewise function uses different formulas for different parts of its domain. These are common in real-world scenarios like tax brackets, utility bills, or postage costs.
Interpreting a piecewise function involves first identifying which "piece" of the domain your input falls into, and then applying the correct rule.
1.1: Four Ways to Represent a Function
The LibreTexts resource provides excellent examples of interpreting functions in various real-world contexts.
Please read the following sections: Start at the definition of a function to refresh the core concept. Read through the police officer example, which shows how to interpret function notation in a real-world context. Finally, look at the days-in-a-month table and the accompanying text to see a simple function represented numerically.
The cost of mailing an envelope, as mentioned in the Asher Roberts video (LINK at 00:24:57), is a classic example of a piecewise-constant function, also known as a step function. The cost is constant for a certain weight interval, and then it "steps up" to the next cost level. Interpreting this function means understanding that an envelope weighing 1.1 ounces costs the same as one weighing 1.9 ounces, but more than one weighing 1.0 ounce.
Conclusion
In this lesson, we moved from simply identifying function representations to actively interpreting them. This is the first and most critical step in applying calculus to solve practical problems.
Key Takeaways:
- Mathematical modeling is a cycle of representing a real-world problem mathematically, analyzing the model, and interpreting the results.
- Graphical representations provide intuitive information about a function's behavior, including its domain, range, intercepts, and intervals of increase or decrease.
- Algebraic representations allow for precise calculations and determination of a function's exact domain by identifying mathematical restrictions.
- Numerical and verbal representations are often the starting point for modeling, from which we can identify trends, define variables, and construct algebraic or graphical models.
We've seen that extracting a function's domain and range is a key part of understanding the relationship it models. In our next lesson, we will focus exclusively on this topic. You'll learn systematic methods for determining the domain and range for a wide variety of functions from their algebraic formulas, sharpening the skills you'll need throughout your calculus journey.