In our last session, we explored the four ways to represent a function and began extracting key information from them, setting the stage for mathematical modeling. We saw that understanding a function's "rules of engagement"—its permissible inputs and resulting outputs—is fundamental.
This lesson builds directly on that idea by focusing on the learning outcome: to determine the domain and range of various mathematical functions. We will move from a general awareness of domain and range to a systematic process for finding them. You'll learn how to determine these sets both by interpreting a function's graph and by analyzing its algebraic formula. Mastering this is crucial, as the domain and range define the boundaries within which a mathematical model operates.
What are Domain and Range?
Let's begin by solidifying our definitions. In the simplest terms, for a function :
- The domain is the set of all possible input values (-values).
- The range is the set of all possible output values (-values).
Your background in IT provides a useful parallel. When you design a system or write a program, you define the types of data an input field will accept (e.g., an integer, a string, a value within a certain range). This is "input validation," and it prevents the program from crashing. A function's domain serves the same purpose: it's the set of all inputs for which the function is mathematically well-defined and produces a real number.
To formalize this, please review the definitions from the LibreTexts resource.
1.1: Four Ways to Represent a Function
This reading will provide the formal, set-based definitions of domain and range.
Please read the first three paragraphs of the article, from the start. Then, jump to the "Glossary" at the end and review the definitions for domain and range.
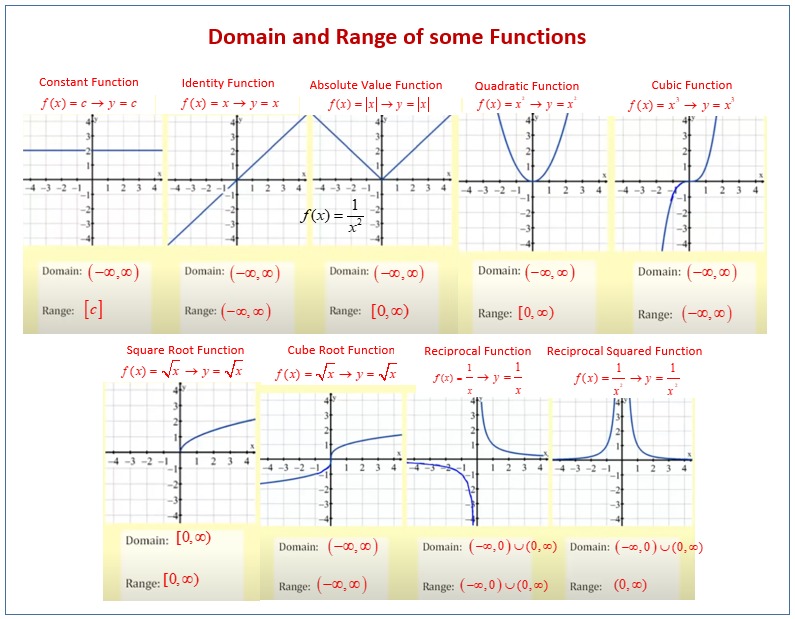
The image below provides a fantastic visual summary of the domain and range for several common "parent" functions. Take a moment to study it and look for patterns. For instance, notice how functions like the square root and reciprocal have restrictions on their domains, while others like the cubic function do not.
Finding Domain and Range from a Graph
The graph of a function gives us a direct picture of its behavior. We can determine the domain and range by seeing how far the function "stretches" along the x and y axes.
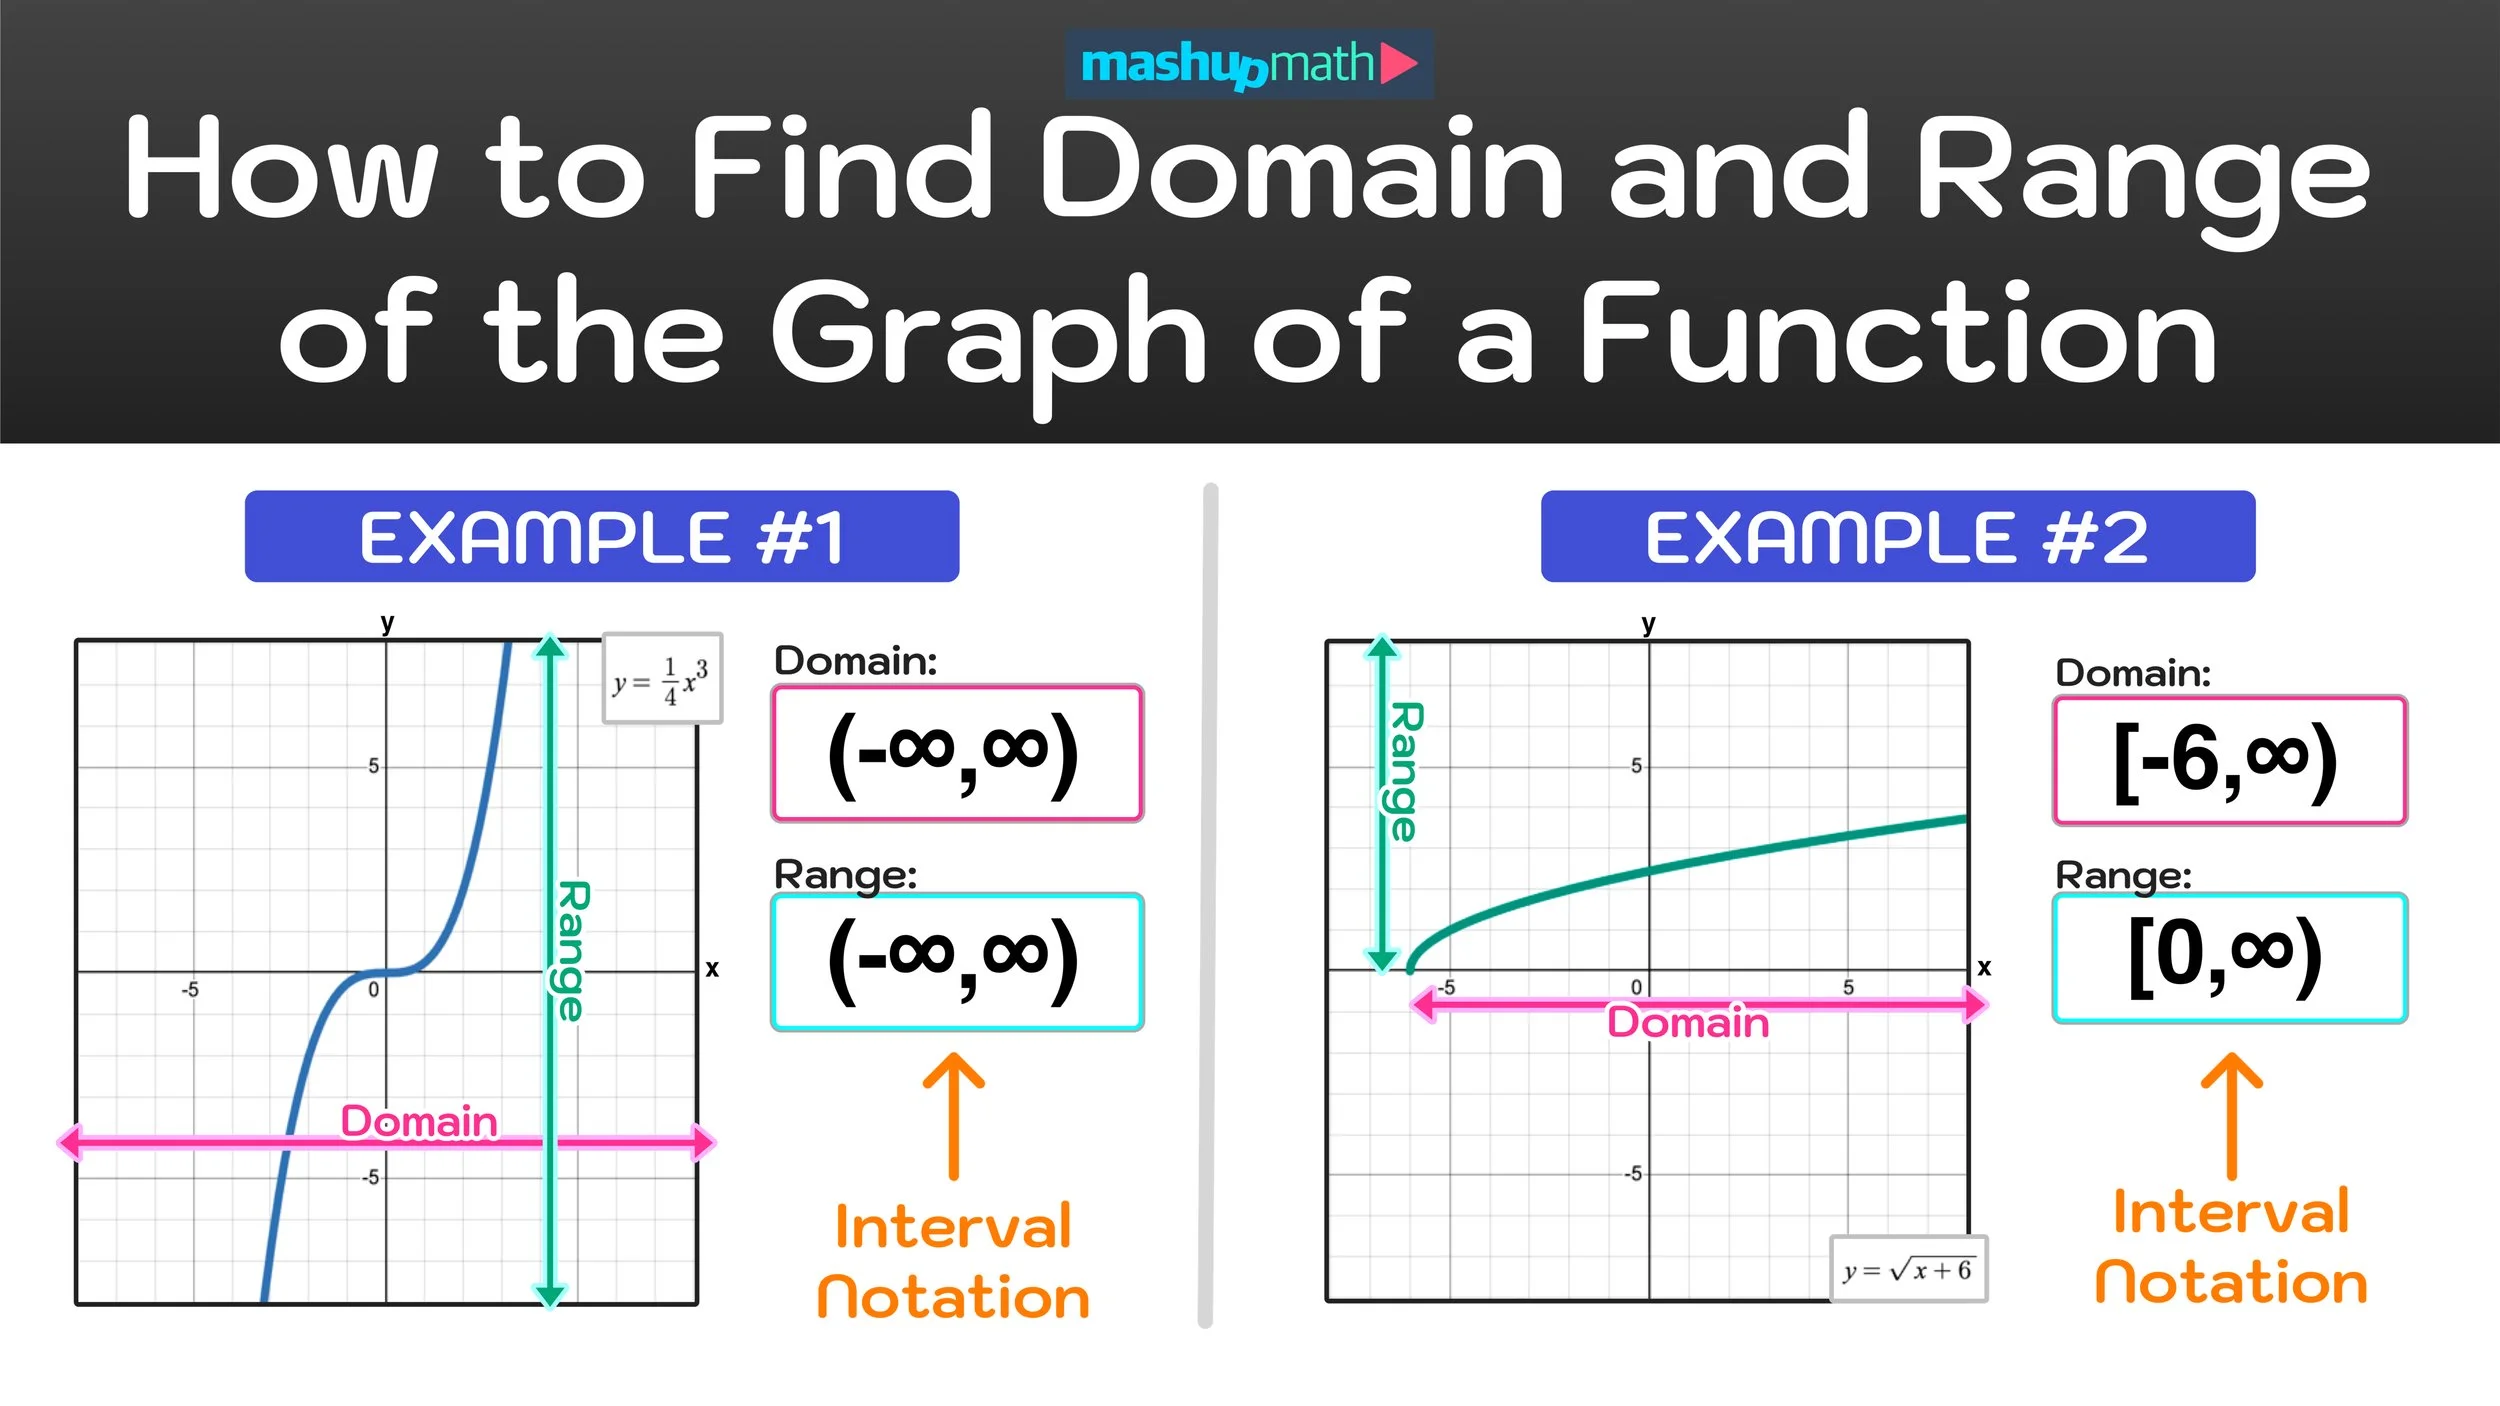
- To find the domain: Imagine squashing the entire graph vertically onto the x-axis. The portion of the x-axis that the graph covers is the domain.
- To find the range: Imagine squashing the entire graph horizontally onto the y-axis. The portion of the y-axis that the graph covers is the range.
The following image illustrates this projection method for a cubic function and a square root function.
This graphical method is powerful, especially for complex graphs with breaks or endpoints. The following video provides a concise tutorial on applying this technique in various scenarios. Pay close attention to how open circles, closed circles, and arrows are handled using interval notation.
Domain and Range of a Function From a Graph
This video, "Domain and Range of a Function From a Graph," provides a step-by-step guide to finding domain and range graphically.
Please watch the following segments, which cover the most common cases you'll encounter: Simple Continuous Function: A basic example using brackets [ ]. Open and Closed Circles: Introduces parentheses ( ) for excluded endpoints. Graphs with Infinity: How to handle arrows that indicate the graph continues forever. Graphs with Jumps: How to use the union symbol ∪ to combine separate intervals.
Finding Domain from an Algebraic Formula
While graphs are intuitive, you will often need to determine the domain directly from a function's algebraic formula. The strategy is to assume the domain is all real numbers, , and then look for values of that would cause a mathematical problem. For the functions we'll study in this course, there are two primary rules to enforce:
- You cannot divide by zero. For any rational function (a fraction), the denominator can never be equal to 0.
- You cannot take an even-indexed root of a negative number. For functions involving square roots, fourth roots, etc., the expression inside the radical (the radicand) must be greater than or equal to 0.
Let's see how these rules are applied. The following comprehensive video covers many function types, but we'll focus on the ones most relevant to these two rules.
Domain and Range Functions & Graphs - Linear, Quadratic, Rational, Logarithmic & Square Root
This video, "Domain and Range Functions & Graphs," provides detailed algebraic methods for finding the domain of different function types.
Please watch these two key sections: Square Root Functions: This segment explains the core principle: set the expression inside the radical to be greater than or equal to zero and solve for x. Rational Functions: Watch from this point to see how to find the domain by setting the denominator equal to zero to find the values that must be excluded. This value corresponds to a vertical asymptote.
Your textbook reinforces these exact points. You can read through the following short example from the Stewart text to see the same logic presented in a textbook format.
This excerpt from your textbook provides clear examples of finding the domain algebraically.
Find "EXAMPLE 3" in the text. Read through the solutions for parts a and b. Notice how it directly applies the two rules we just discussed: the radicand must be \ge 0, and the denominator cannot be 0.
What about other functions?
- Polynomials (e.g., or ): Since there is no division by a variable and no square roots, there are no restrictions. The domain of any polynomial function is all real numbers, .
- Odd-indexed roots (e.g., ): You can take the cube root of a negative number (e.g., ). Therefore, odd-indexed roots do not impose any restrictions on the domain.
A Note on Finding the Range Algebraically
Finding the range from a formula can be more challenging than finding the domain. There isn't a single, universal method. However, two common strategies are:
-
Use knowledge of parent functions and transformations. If you know the range of is , then the range of is , because the entire graph is shifted up by 3 units. Similarly, since the range of is , the range of is because the graph is reflected across the x-axis.
-
Analyze the function's characteristics. The vertex of a parabola determines its minimum or maximum value, which in turn defines the boundary of its range. A horizontal asymptote of a rational or exponential function often defines a boundary for its range.
The video from The Organic Chemistry Tutor demonstrates this well.
Domain and Range Functions & Graphs - Linear, Quadratic, Rational, Logarithmic & Square Root
Let's revisit the same video to see how range is determined.
Quadratic Functions: Watch from this segment. Notice how the y-coordinate of the vertex (-9 in his example) becomes the minimum value and thus the starting point of the range. Square Root Functions: Watch from this part. He shows how the vertical shift (+1) determines the starting point of the range for the function y = \sqrt{x-2}+1.
Conclusion
In this lesson, you developed a systematic toolkit for determining the domain and range of functions, a fundamental skill in calculus. You learned to "read" the domain and range from a graph and how to deduce them from an algebraic formula by looking for mathematical restrictions.
Key Takeaways:
- The domain is the set of all valid -values (inputs), while the range is the set of all resulting -values (outputs).
- From a graph, the domain is the projection onto the x-axis, and the range is the projection onto the y-axis. Use interval notation with
( )for excluded points and[ ]for included points. - From a formula, the domain is typically found by excluding values that cause division by zero or even roots of negative numbers.
- The range is often determined by analyzing transformations of parent functions or by finding key features like vertices and asymptotes.
In our next lesson, we will continue our investigation of function properties by exploring symmetry. We will learn to identify even, odd, and periodic functions from their graphs and algebraic definitions, adding another layer to our ability to describe and classify functions.