Hello! Welcome to your next lesson in the "Process, Service, and Task Management" module.
In our previous lesson, we learned how to take a static snapshot of the running processes using the ps command. This is an essential skill, but it only shows you a single moment in time. For effective system administration and troubleshooting, you need to see how your system behaves in real-time.
This lesson directly addresses that need. Our learning outcome is to monitor processes and system resources interactively using top and htop. These two commands are the go-to tools for live system monitoring on Linux. We'll start with the classic top command, which is guaranteed to be on any Linux system you encounter, and then move to its powerful and user-friendly successor, htop.
1. The top Command: The Classic Real-Time Monitor
The top command gives you a dynamic, real-time view of your running system. Because it's a standard utility included in virtually every Linux distribution, knowing how to use it is a non-negotiable skill for the CompTIA Linux+ exam and for any system administration role.
To get started, simply open a terminal and type:
top
To exit top at any time, just press the q key.
Demystifying the top Command in Linux | Linux Crash Course Series
The video 'Demystifying the top Command in Linux' from Learn Linux TV provides an excellent, in-depth guide. Let's start with the basics of its interface.
Watch from 02:12 to 03:48. This section shows you how to launch and quit top and introduces its two main sections: the system summary at the top and the process table at the bottom.
As the video points out, the top interface is split into two main areas. Let's break down the information presented in each.
Understanding the Summary Area (Header)
The first five lines of the top output provide a high-level summary of your system's state. It's packed with information, so let's go through it line by line.
Demystifying the top Command in Linux | Linux Crash Course Series
The same video provides a detailed explanation of each line in the summary area. We'll go through it piece by piece.
Please watch from 03:48 to 16:57. This is a longer segment, but it's crucial for understanding the data. Focus on grasping the meaning of: Line 1: Uptime and Load Average (What do the three numbers mean?) Line 2: Task states (running, sleeping, zombie) Line 3: CPU states (us, sy, id, wa) Lines 4 & 5: Memory (Mem) and Swap usage
Let's summarize those key metrics:
-
Line 1 (top):
- Uptime: How long the system has been running. A unexpectedly low uptime could indicate a recent crash or reboot.
- Load Average: A measure of system load over the last 1, 5, and 15 minutes. A simplified rule of thumb is that a load average equal to the number of CPU cores means the system is fully utilized. For example, a load average of 4.00 on a 4-core system is 100% utilization.
-
Line 2 (Tasks):
- This shows the total number of processes broken down by their state. You'll recognize these states from our previous lesson on
ps:running,sleeping,stopped, andzombie. Most processes will be in thesleepingstate, waiting for input or an event.
- This shows the total number of processes broken down by their state. You'll recognize these states from our previous lesson on
-
Line 3 (%Cpu(s)):
- us: user space — Percentage of CPU time spent running user applications.
- sy: system (kernel) space — Percentage of CPU time spent on kernel tasks.
- ni: nice — Percentage of CPU time spent on processes with a manually set priority.
- id: idle — Percentage of time the CPU was doing nothing. A high idle value means your system is not busy.
- wa: I/O wait — Percentage of time the CPU was waiting for Input/Output operations (like reading from disk) to complete. High
wacan indicate a slow storage device or disk-heavy workload.
-
Lines 4 & 5 (Mem and Swap):
- These lines show your total, free, and used physical memory (RAM) and swap space. Remember that Linux uses free memory for caching, so seeing a high "used" value isn't necessarily a problem unless your swap usage is also high. High swap usage is a strong indicator that your system is running out of physical RAM.
Understanding the Process List
The bottom section of top is a list of individual processes, similar to the output of ps. By default, it's sorted by CPU usage.
Demystifying the top Command in Linux | Linux Crash Course Series
Let's quickly review the columns in the process list.
Watch from 16:57 to 18:03. Many of these columns should be familiar from the ps command.
Key columns in the process list include:
- PID: Process ID
- USER: The user who owns the process
- PR: Priority of the process
- NI: The "Nice" value, which influences the priority
- VIRT, RES, SHR: Virtual, Resident, and Shared memory usage
- S: Process Status (e.g.,
Rfor running,Sfor sleeping) - %CPU: Percentage of CPU usage
- %MEM: Percentage of RAM usage
- TIME+: Total CPU time the process has used
- COMMAND: The command that started the process
2. Interacting with top
Now for the "interactive" part. top is not just a display; you can issue commands to change what it shows and manage processes directly.
Demystifying the top Command in Linux | Linux Crash Course Series
The 'Demystifying the top Command' video also demonstrates the most common interactive commands.
Watch from 18:03 to 20:49. Pay close attention to the keys used for sorting, killing a process, and changing the update delay.
Here are the most important interactive commands to remember:
- Sorting:
Shift + P: Sort by CPU usage (this is usually the default).Shift + M: Sort by Memory usage.
- Managing Processes:
k: "Kill" a process.topwill prompt you for the PID of the process you want to terminate and then the signal to send (the default is 15, or SIGTERM). This is a preview of our next lesson on signals!
- Customizing the View:
d: Change the update delay. The default is 3 seconds.q: Quittop.
Test your understanding!
You run top and notice your system is very sluggish. The %CPU column shows low values for all processes, but the wa value in the CPU summary line is very high (e.g., 70%). What is the likely cause of the slowdown?
Show answer
A high wa (I/O wait) value indicates that the CPU is spending most of its time waiting for storage operations to complete. The bottleneck is likely not the CPU itself, but a slow hard drive or a process that is performing a huge number of disk reads/writes.
3. htop: The Modern Interactive Monitor
While top is essential, htop is what many system administrators prefer for day-to-day use. It's an enhanced, more visual, and user-friendly process monitor. It does everything top does, but often in a more intuitive way.
First, you may need to install it, as it's not always included by default:
- On Debian/Ubuntu:
sudo apt install htop - On RHEL/CentOS/Fedora:
sudo dnf install htop

The htop Interface
Let's get acquainted with the htop display.
The video 'Linux Tip | How to use Htop' by Joe Collins gives a great tour of the htop interface and its advantages over top.
Watch from the beginning to 04:20. The video introduces htop, compares it to top, and then breaks down the different sections of its display.
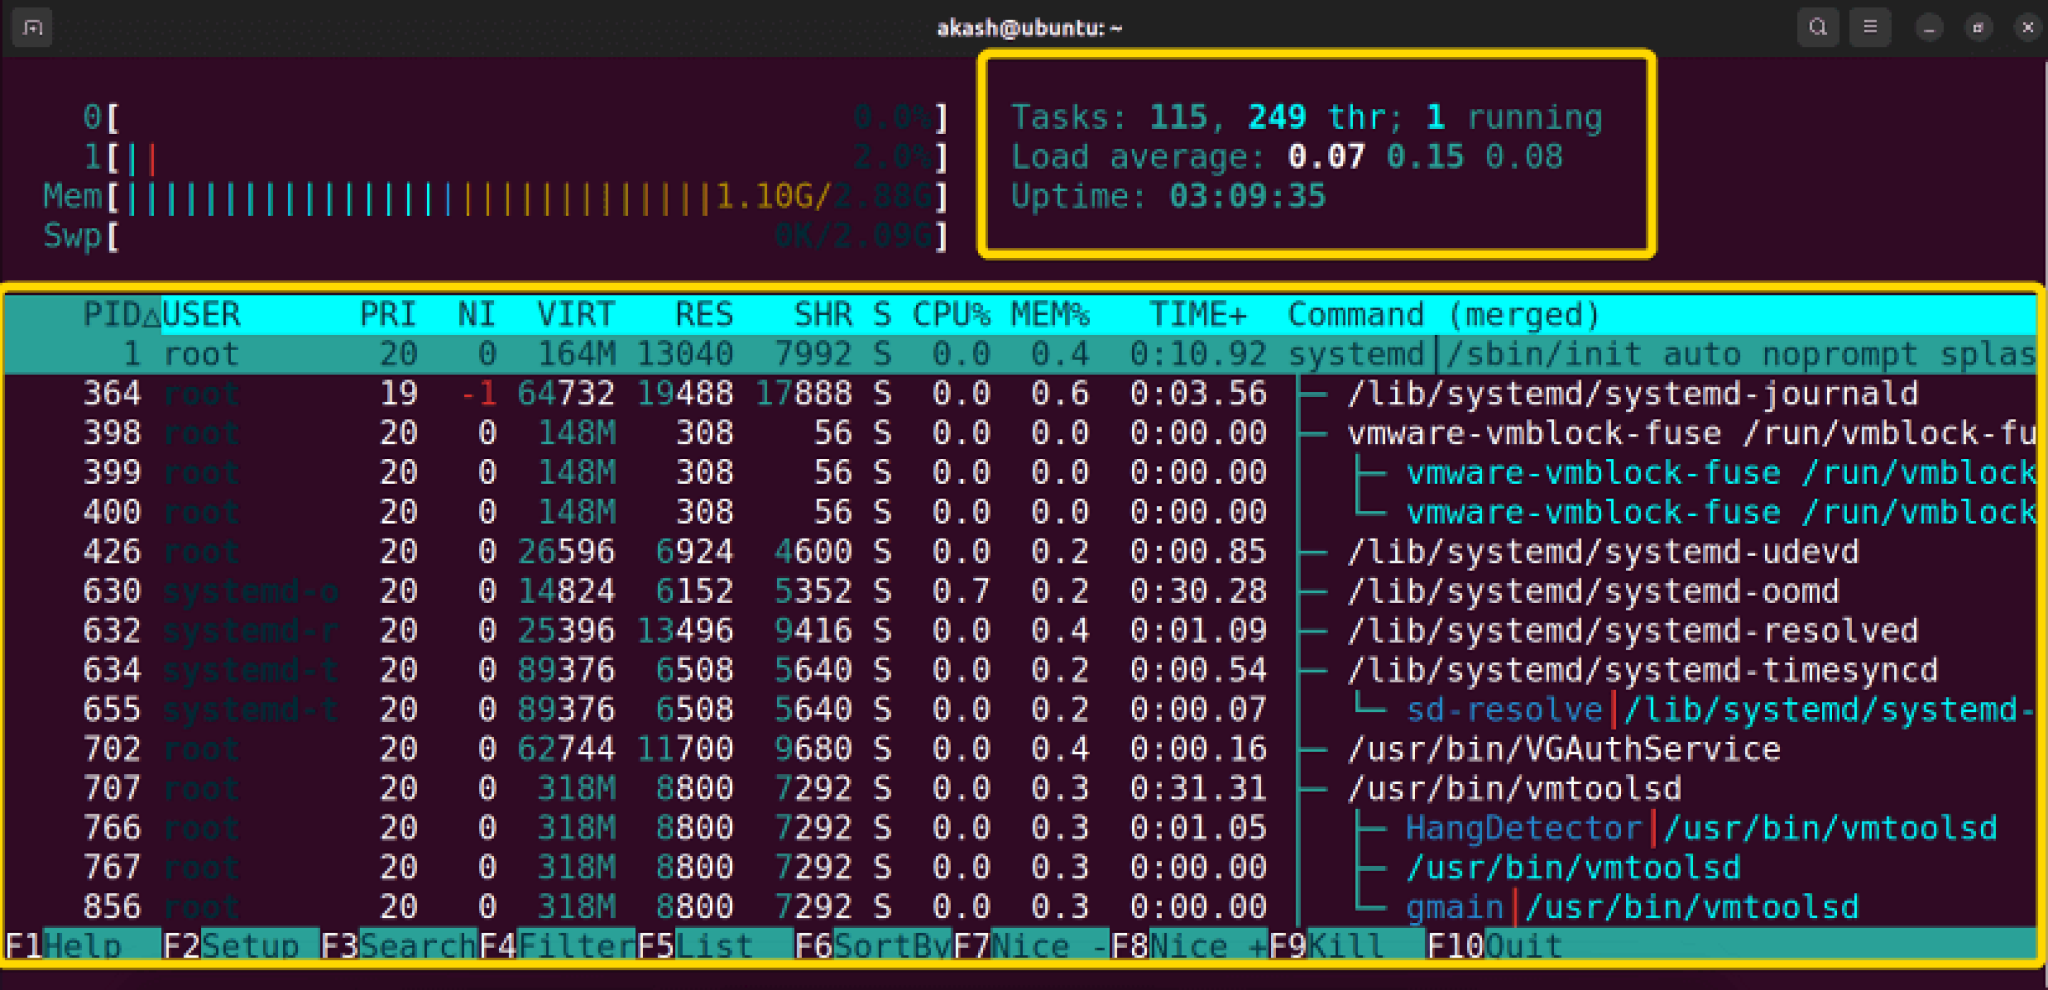
Key features of the htop interface:
- Graphical Meters: The top-left provides easy-to-read, color-coded bar graphs for each CPU core, memory usage, and swap usage.
- Clear Summary: The top-right shows task counts, load average, and uptime.
- Scrolling: You can scroll the process list vertically and horizontally with your arrow keys or mouse.
- Function Key Menu: The bottom of the screen always shows you the available interactive commands, so you don't have to memorize them.
4. Interacting with htop
This is where htop truly shines. Nearly all actions are performed with the function keys (F1-F10).
Let's explore some of htop's most powerful interactive features with the same video.
Watch from 06:01 to 07:47, and then from 11:49 to 13:05. This covers searching, filtering, tree view, and killing processes.
Here are the essential interactive commands for htop:
- Navigation and Sorting:
- Use the arrow keys to select a process.
F6: Brings up a menu to sort by any column (or just click the column header with your mouse).
- Searching and Filtering:
F3: Search for a process by name.F4: Filter the list to show only processes matching a certain string.
- Process Hierarchy:
F5: Toggle the tree view, which shows parent-child process relationships, similar tops axjffrom our last lesson.
- Managing Processes:
F9: "Kill" a process. After selecting a process, pressing F9 brings up a menu of signals you can send. This makes it easy to choose between gracefully asking a process to terminate (SIGTERM) or forcing it to stop (SIGKILL).F7&F8: Decrease or increase a process's "Nice" value, adjusting its scheduling priority.
Conclusion
You now have the two most important tools for live system monitoring in your toolkit. While ps gives you a precise snapshot, top and htop give you the full motion picture of your system's activity.
Key Takeaways:
topis the classic, universally available real-time process monitor. You must know how to read its summary data (load average, memory, CPU states) and perform basic interactions like sorting and killing processes.htopis a modern, user-friendly alternative that provides a more intuitive and visually informative experience with color-coding, graphical meters, and an easy-to-use function key menu.- Both tools allow you to identify processes consuming high CPU or memory, a critical skill for troubleshooting performance issues.
- The ability to send signals to processes from within these tools (
kintop,F9inhtop) is a fundamental part of process management.
Preview of the Next Lesson:
We've now touched on the concept of "killing" a process by sending it a signal multiple times. In the next lesson, "Send signals to processes using kill and killall commands," we will focus entirely on this concept. You'll learn what signals are, the difference between important signals like SIGTERM and SIGKILL, and how to use the kill and killall commands to precisely control your running processes from the command line.