Hello! Welcome to the next module in your Linux+ preparation journey.
In the previous module, we finished by looking at how to manage the software installed on your system, culminating in the safe way to update the Linux kernel. We've established a solid foundation in managing the static part of the system—the files and packages on disk.
Now, we will shift our focus to the dynamic part of the system: the software that is actively running. This lesson kicks off Module 7, "Process, Service, and Task Management." Our goal is to master the first step in controlling your system: understanding what it's doing right now. To that end, you will learn how to list and interpret process information using the ps command. This is a fundamental skill for any Linux administrator, essential for troubleshooting, monitoring, and security.
1. What Is a Process?
Before we start listing processes, let's establish a clear definition. A process is simply an instance of a program that is currently running. When you launch a web browser, a terminal, or even run a simple command like ls, you are creating one or more processes.
Each process is unique and has several key identifiers, but two are the most important:
- Process ID (PID): A unique number assigned by the kernel to identify the process.
- Parent Process ID (PPID): The PID of the process that started this one.
All processes on a Linux system form a hierarchy, or tree, that originates from a single process started by the kernel at boot time, which always has a PID of 1.
Linux processes, init, fork/exec, ps, kill, fg, bg, jobs
The video 'Linux processes, init, fork/exec, ps, kill...' from Engineer Man provides a concise explanation of what processes are and introduces the concept of the init process (PID 1).
Please watch the first two minutes of the video (00:08 to 01:56). Focus on the definitions of a process, PID, PPID, and the special role of the init process (PID 1).
As the video explained, every process on your system can trace its lineage back to that initial process, often systemd on modern systems. This parent-child relationship is a crucial concept that we'll see reflected in the output of the ps command.
2. Basic Process Snapshots with ps
The primary command for viewing a list of processes is ps, which stands for "process status." It provides a snapshot of the processes running at the moment you execute the command. This is different from a continuously updating, real-time view, which we will cover in the next lesson.
Let's start by running ps with no options in your terminal:
ps
The output is minimal, showing only the processes running in your current terminal session.
Linux Crash Course - The ps Command
For a detailed walkthrough of the ps command, we'll use the 'Linux Crash Course - The ps Command' video from Learn Linux TV. Let's start with the basics.
Watch the beginning of the video (00:05 to 03:50). The presenter explains the default output of ps and what each column (PID, TTY, TIME, CMD) means.
The key takeaways are:
- PID: The unique Process ID.
- TTY: The "teletype" or terminal that controls the process.
- TIME: The total amount of CPU time the process has used (not wall-clock time).
- CMD: The command that started the process.
3. Viewing All System Processes
While the default output is a good start, it's not very useful for system administration. We typically need to see processes running outside of our own terminal—system services, other users' applications, and kernel threads.
To do this, we use options with the ps command. As you'll see, ps has a somewhat confusing history, leading to different styles of options.
Linux Crash Course - The ps Command
The same video explains the three different styles of options you can use with ps.
Continue watching from 03:50 to 05:58. Pay attention to the distinction between UNIX style (e.g., -e), BSD style (e.g., aux), and GNU style (e.g., --deselect). We'll focus on the first two, as they are the most common.
For the CompTIA Linux+ exam and real-world usage, you need to be very familiar with two specific invocations:
ps aux(BSD style)ps -ef(UNIX style)
Let's break down each one.
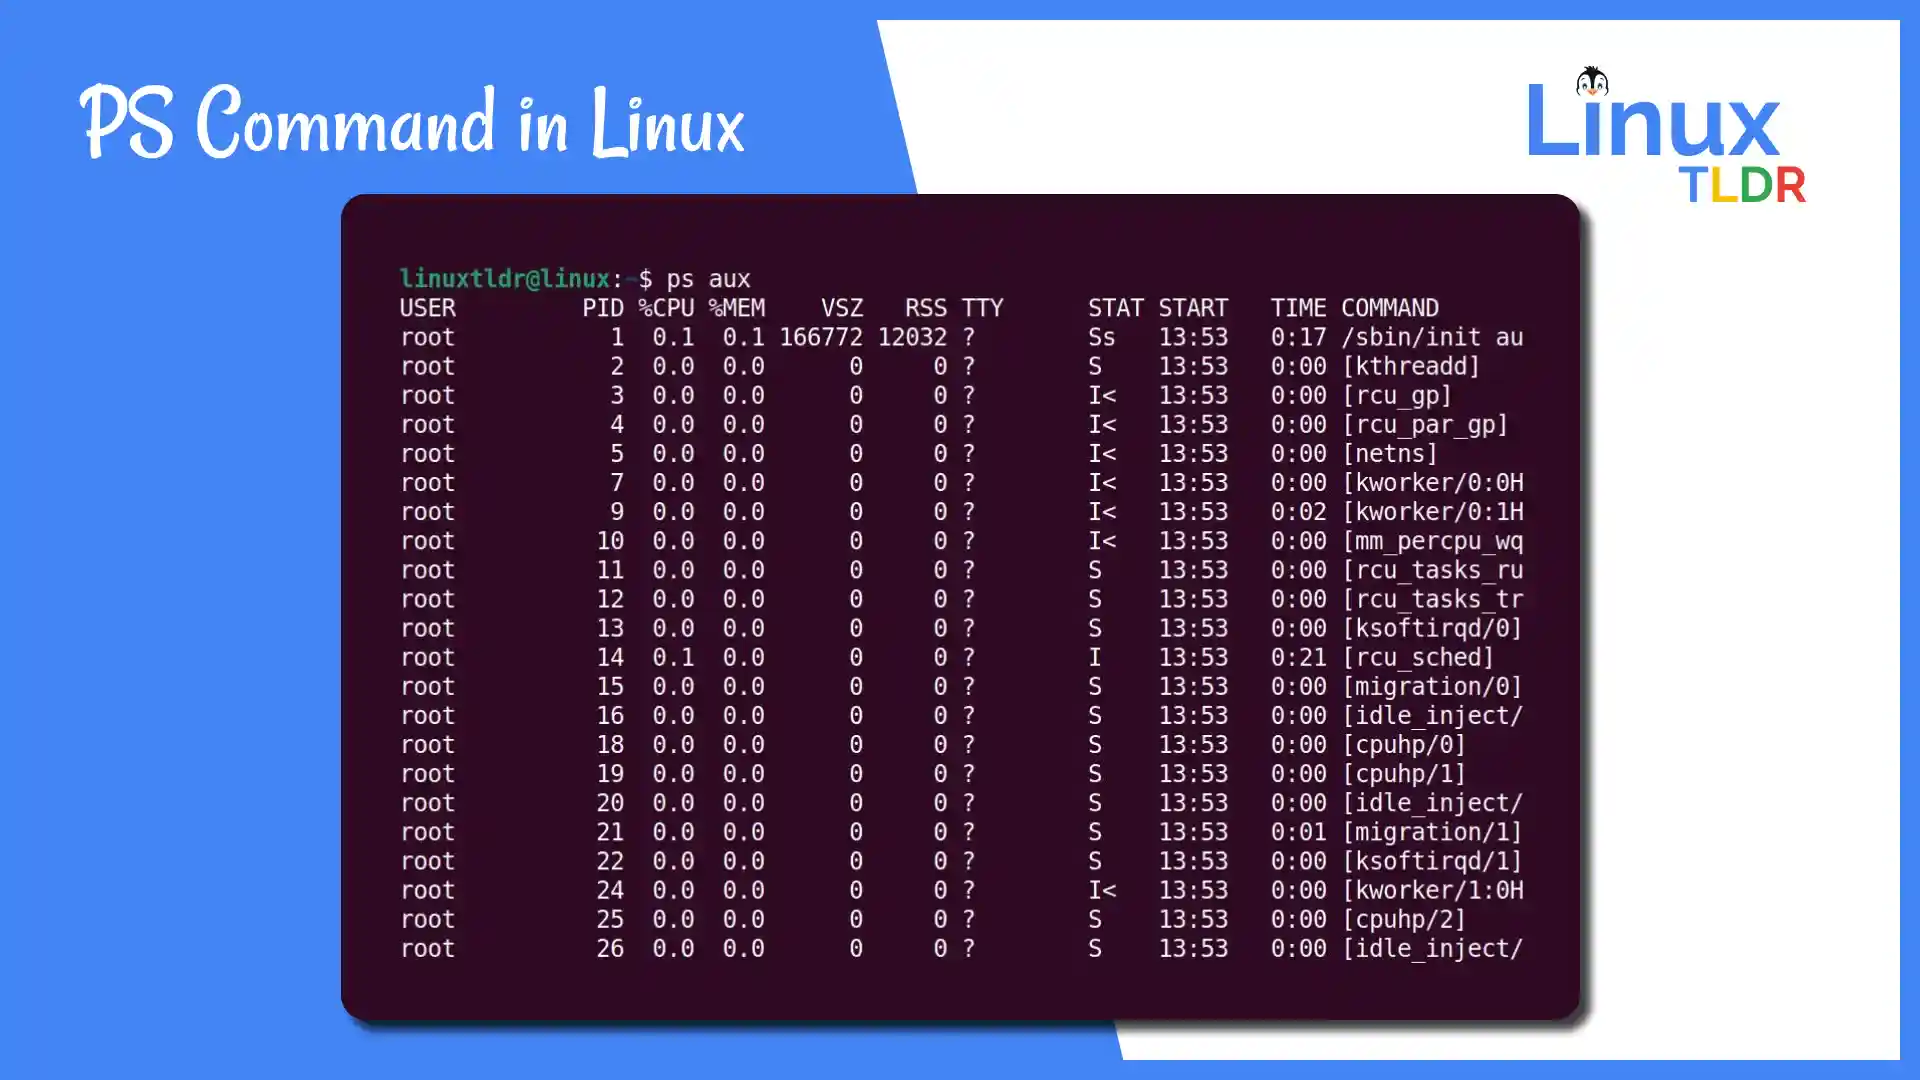
The ps aux Command (BSD Style)
This is one of the most common ways to see every process on the system. The options mean:
- a: Show processes for all users.
- u: Display in a user-oriented format.
- x: Show processes not attached to a terminal (like system daemons).
Linux Crash Course - The ps Command
The 'Linux Crash Course' video has an excellent section dedicated to ps aux, which is arguably the most popular format.
Watch from 11:40 to 15:20. The presenter breaks down the most important columns provided by ps aux, such as USER, %CPU, %MEM, and START.
Let's review the key columns from ps aux:
- USER: The user who owns the process.
- PID: The Process ID.
- %CPU: The percentage of CPU the process is using.
- %MEM: The percentage of physical memory (RAM) the process is using.
- VSZ: Virtual memory size of the process.
- RSS: Resident Set Size (the portion of RAM the process is actually using).
- TTY: The controlling terminal. A
?means no controlling terminal. - STAT: The process state code (we'll look at this next).
- START: The time the process was started.
- TIME: Cumulative CPU time used.
- CMD: The command that started the process.
The ps -ef Command (UNIX Style)
This is the other common way to see every process. The options mean:
- -e: Show every process.
- -f: Show in full-format listing.
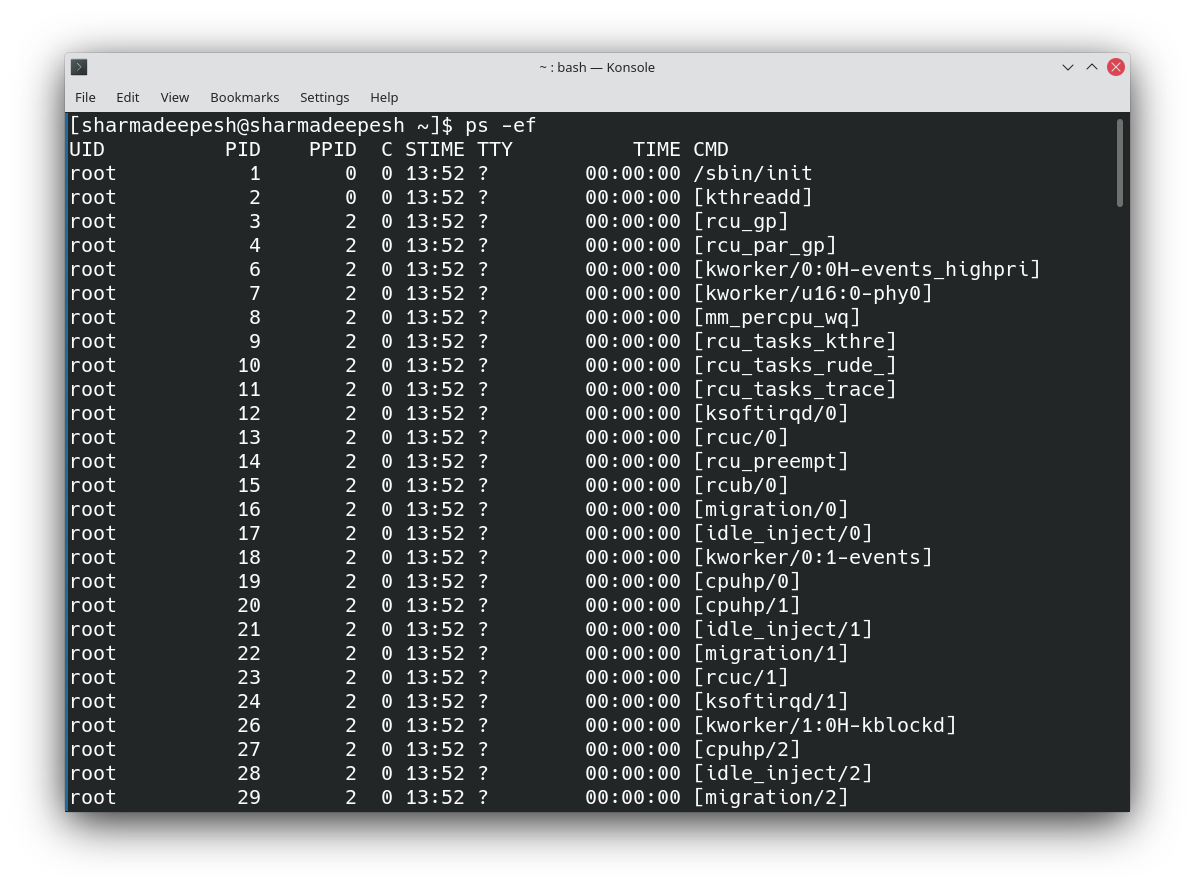
This format is particularly useful for tracing process lineage.
The Baeldung article 'Linux ps Command' provides a great textual reference for the columns in the -ef format.
Please read section '3.1. Listing All Processes'. Focus on the explanation of the output from ps -e -f and the meaning of the new columns: UID, PPID, C, and STIME.
Key columns from ps -ef:
- UID: The User ID of the process owner.
- PID: The Process ID.
- PPID: The Parent Process ID. This is a key column for seeing the process hierarchy.
- C: CPU utilization (similar to %CPU, but often just for scheduling).
- STIME: The start time of the process.
- TTY: The controlling terminal.
- TIME: Cumulative CPU time used.
- CMD: The command.
Test your understanding!
- You are troubleshooting a slow system and suspect a single process is consuming all the memory. Using
ps aux, which column would you sort by or look at to find the culprit? - You notice a suspicious process named
x86_64-checkerand want to know what started it. Usingps -ef, how would you determine its parent process?
Show answer
- You would look at the %MEM column. This shows the percentage of physical memory each process is using.
- You would find the line for
x86_64-checkerand look at its PPID column. You could then find the process with a PID matching that PPID to identify the parent.
4. Interpreting the Process State (STAT)
In the ps aux output, the STAT column tells you what a process is currently doing. This is a multi-character code.
Linux Crash Course - The ps Command
Let's return to the 'Linux Crash Course' video to understand some of the most common process states.
Watch the section from 05:58 to 08:34. It covers several important state codes, including R, S, and T.
Here is a summary of the most common states you will encounter:
- R (Running or Runnable): The process is either currently executing on a CPU core or is in the queue, ready to run.
- S (Interruptible Sleep): The process is waiting for an event to complete (e.g., user input, network data). This is the most common state for processes on a typical system.
- D (Uninterruptible Sleep): The process is waiting for I/O (like reading from a disk) and cannot be interrupted. Processes stuck in this state can be a sign of hardware problems.
- Z (Zombie): The process has terminated, but its entry in the process table has not been removed by its parent yet. A few zombies are normal, but a large number can indicate a problem with the parent application.
- T (Stopped): The process has been stopped by a job control signal (like pressing
Ctrl+Z) or because it is being debugged.
You might also see modifiers, like s (the process is a session leader) or + (the process is in the foreground).
5. Filtering and Searching for Processes
Often, the full output of ps aux or ps -ef is overwhelming. You usually want to find one specific process. There are two main ways to do this.
Method 1: Piping to grep
The classic, universal method is to pipe the output of ps to the grep command to filter for a specific name.
Manage and Monitor Linux Processes | CompTIA Linux+
The LabEx tutorial 'Manage and Monitor Linux Processes' demonstrates this common technique.
Read the section 'Inspect Running Processes with ps'. Focus on the part where it introduces the command ps aux | grep sleep. Notice that the grep command itself often appears in the output.
For example, to find all processes related to the Firefox browser, you would run:
ps aux | grep firefox
Method 2: Using ps Built-in Filters
The ps command also has its own options for more precise filtering, which can be cleaner than using grep.
The Baeldung article provides clear examples of these built-in filtering options.
Read sections '3.2. Simple Filtering' and '4.3. Controlling the Output'. This will show you how to filter by command name (-C), process ID (-p), user (-u), and how to select specific columns with the -o flag.
Here are the most useful filtering flags:
ps -C <command_name>: Find a process by its exact command name (e.g.,ps -C firefox).ps -u <username>: Show all processes owned by a specific user (e.g.,ps -u www-data).ps -p <PID>: Show information for a specific process ID (e.g.,ps -p 1234).- You can also customize the output columns with
-o. For example, to see just the PID, user, and command for a process:ps -C firefox -o pid,user,cmd.
6. Visualizing the Process Hierarchy
To clearly see the parent-child relationships we discussed at the beginning, you can ask ps to display the output as a tree.
Linux Crash Course - The ps Command
Finally, let's see how to visualize the process tree. The 'Linux Crash Course' video demonstrates a powerful command for this.
Watch from 08:22 to 11:40. This section explains how to use options like -He and axjf to show process hierarchy and explains the extra columns like PPID and PGID in more detail.
The command ps axjf is excellent for this. The j provides job control format and the f provides the "forest" or tree view, visually linking child processes to their parents. This is invaluable for understanding how a complex application, like a web server or desktop environment, is structured.
Conclusion
You have just learned one of the most fundamental commands in Linux system administration. Being able to list and interpret the processes running on your system is the first step toward managing them effectively.
Key Takeaways:
- A process is a running instance of a program, identified by a unique PID and linked to its creator via a PPID.
- The
pscommand provides a snapshot of the process table. - The most common and useful invocations are
ps auxandps -ef, which show all processes on the system. - Key columns like
USER,PID,PPID,%CPU,%MEM, andSTATgive you critical information about each process's owner, identity, resource usage, and current state. - You can find specific processes by filtering the
psoutput withgrepor by using built-in options like-C(command),-u(user), and-p(PID). - Process hierarchy can be visualized with commands like
ps axjf.
Preview of the Next Lesson:
While ps is perfect for a static snapshot, it doesn't show you what's happening in real-time. In our next lesson, we will explore tools that do exactly that: top and htop. These interactive utilities will allow you to monitor processes and system resources as they change, building directly on the concepts you've learned today.