Hello! Welcome to the first lesson in our new module on Troubleshooting, Recovery, and Maintenance.
In our last module, we focused on hardening the system, culminating in a lesson on tuning the kernel itself with sysctl. Now, we shift our perspective from proactive hardening to reactive troubleshooting. When a system slows down, a system administrator needs a clear, methodical approach to find and fix the problem.
Today's lesson is designed to give you that foundation. Our goal is to learn how to diagnose high CPU, memory, and disk I/O issues using system monitoring tools. We'll explore the most common performance bottlenecks and the essential command-line tools you'll use to identify them. This is a core skill for any Linux professional and a key topic for the CompTIA Linux+ exam.
A Methodical Approach to Troubleshooting
When a system is slow, it's tempting to start running commands randomly. A better approach is to be systematic. A widely used methodology in performance analysis is the USE Method:
- Utilization: For a given resource (like a CPU or disk), what percentage of its capacity is being used?
- Saturation: Is the resource so busy that work is queuing up, waiting to be processed?
- Errors: Are there any explicit errors occurring?
Throughout this lesson, we'll apply this thinking to the three pillars of system performance: CPU, Memory, and I/O.
1. Diagnosing High CPU Usage
A CPU-bound system is one where the processor is the limiting factor. Programs are ready to run, but they have to wait for their turn on the CPU.
Key Tools and Metrics
-
uptimeand Load Average:
This command gives you a quick snapshot of system health, including the load average.uptime # 10:30:01 up 5 days, 16:21, 1 user, load average: 1.50, 0.80, 0.65The three numbers represent the average number of processes in the run queue (running or waiting to run) over the last 1, 5, and 15 minutes.
The critical insight is to compare the load average to the number of CPU cores on your system. You can find your core count with
nproc.- If
load average < number of cores: The system is handling the load. - If
load average > number of cores: The system is saturated. Work is queuing up faster than the CPUs can process it.
- If
-
top- The System Dashboard:topprovides a real-time, dynamic view of the system. The summary at the top provides crucial clues:load average: The same values asuptime.%Cpu(s): A breakdown of what the CPU is spending its time on.us: user space — time spent running user applications.sy: system space (kernel) — time spent on kernel tasks, like handling I/O or system calls.id: idle — time the CPU has nothing to do.wa: I/O wait — time the CPU is idle but waiting for a disk or network operation to complete.
A high %us or %sy value, combined with low %id, points to a CPU bottleneck.
Let's watch a practical demonstration of identifying a CPU-bound system.
Linux Performance: Is it CPU, Memory, or I/O? | Into the Terminal 166
The video "Linux Performance: Is it CPU, Memory, or I/O?" from Red Hat Enterprise Linux provides an excellent, real-world walkthrough. This first segment shows how to use top to diagnose a system that is slow due to high CPU load.
Watch from 03:00 to 10:14. Pay close attention to how the presenter interprets the load average and the %CPU column in top to identify that the system is CPU-bound. Notice the characteristic sign: many processes all consuming a similar, small amount of CPU because they are all competing for limited resources.
htop- A Friendliertop
Whiletopis standard,htopis an popular alternative that many find more intuitive. It provides the same information in a color-coded, easier-to-read format with a few extra features. It is not installed by default on all systems but is usually available in the main repositories.

Test your understanding!
You run uptime on a server with 4 CPU cores and see the following output:load average: 6.10, 4.50, 2.15
Based on this information, what is the most likely state of the system?
A. The system is idle.
B. The system is experiencing a disk I/O bottleneck.
C. The system's CPU is saturated, and tasks are queuing up.
D. The system has a memory leak.
Show answer
The correct answer is C. The 1-minute load average (6.10) is significantly higher than the number of CPU cores (4). This indicates that, on average, there are more than 6 processes either running or waiting for CPU time, meaning the CPUs are saturated and cannot keep up with the demand.
2. Diagnosing Disk I/O Issues
An I/O-bound system is one where performance is limited by the speed of its disks or network interfaces. The CPU is often idle because it's waiting for data to be read from or written to a storage device.
Key Tools and Metrics
The first clue often comes from the %wa (I/O wait) value in top or vmstat. If this number is consistently high, your CPUs are spending a lot of time waiting on I/O.
-
iostat- I/O Statistics:
This is the primary tool for drilling into disk performance. Runningiostat -x 1will give you extended statistics, updated every second.$ iostat -x 1 Device: ... r/s w/s rkB/s wkB/s ... await %util sda ... 2.45 8.67 45.23 156.89 ... 7.23 2.8Key columns to watch:
%util: The percentage of time the disk was busy. If this is consistently above 80-90%, the disk is saturated.await: The average time (in milliseconds) an I/O request waits for completion. High values indicate slow disk response.avgqu-sz: The average queue length. A high number means I/O requests are piling up, waiting to be serviced by the disk.
-
psand Uninterruptible Sleep (Dstate):
Sometimes, a process becomes "stuck" waiting for an I/O operation that will never complete (e.g., waiting on a disconnected network drive). These processes enter an uninterruptible sleep state, marked with aDin theSTATcolumn ofps aux. A large number of processes in theDstate is a strong indicator of a severe I/O problem.
The next video segment demonstrates how to track down a tricky I/O issue caused by a failed network mount.
Linux Performance: Is it CPU, Memory, or I/O? | Into the Terminal 166
Continuing with the Red Hat video, this part tackles an I/O problem. It's a fantastic example because the issue isn't a slow local disk, but a hung network share, which requires a different diagnostic path.
Watch from 18:56 to 31:06. Focus on how the presenters use vmstat and iostat but don't see high disk activity. This leads them to investigate other causes, ultimately using ps aux | grep ' D ' to find processes stuck in uninterruptible sleep, pointing to the real problem.
3. Diagnosing High Memory Usage
A system experiences memory pressure when it doesn't have enough physical RAM to hold all the active programs and data. To compensate, the kernel starts moving less-used memory pages to a dedicated disk area called swap space. Because disks are orders of magnitude slower than RAM, heavy swapping can bring a system to a crawl.
Key Tools and Metrics
-
free -h- Memory Overview:
This is the quickest way to check your memory status.$ free -h total used free shared buff/cache available Mem: 7.7Gi 2.1Gi 3.7Gi 1.0Mi 1.9Gi 5.3Gi Swap: 2.0Gi 0B 2.0Gifreevs.available: Don't be alarmed by a lowfreevalue. Linux uses spare RAM for disk caching (buff/cache) to speed things up. Theavailablecolumn gives a more realistic estimate of how much memory can be made available for new applications without swapping.Swap: Watch theusedvalue here. If it's consistently high or increasing, your system is actively swapping.
-
vmstat- Virtual Memory Statistics:
Runningvmstat 1gives you a second-by-second update on memory activity.$ vmstat 1 procs -----------memory---------- ---swap-- -----io---- -system-- ------cpu----- r b swpd free buff cache si so bi bo in cs us sy id wa st 2 0 0 1843200 80532 947012 0 0 5 23 45 78 3 1 96 0 0The
swapcolumns are critical:si(swap in): Memory being read from swap back into RAM.so(swap out): Memory being written from RAM to swap.
Any sustained, non-zero activity insiorsoindicates memory pressure.
-
The OOM Killer:
In extreme cases of memory exhaustion, the kernel invokes the Out-Of-Memory (OOM) Killer. It chooses a process (based on a heuristic score) and kills it to free up memory. You will see messages about this in the kernel logs, which you can view withdmesgorjournalctl -k. If you see OOM killer messages, your system is under severe memory distress.
This final video segment covers these memory monitoring tools and the OOM killer.
Linux Performance: Is it CPU, Memory, or I/O? | Into the Terminal 166
This last clip from the Red Hat video focuses on memory. It explains how to interpret free and vmstat, what the OOM killer is, and even touches on advanced concepts like checking /proc/meminfo.
Watch from 42:24 to 53:10. Focus on understanding how to identify swap activity with vmstat and what it means when the OOM killer is invoked. The discussion about what swapping means on modern systems is also very insightful.
A Practical Diagnostic Workflow
You now have tools for each subsystem. The real skill is putting them together. Here's a logical workflow to follow when a system is slow:
- Overall Health Check (
uptime): Is the load average high compared to the number of CPUs? This is your first and fastest clue. - Find the Bottleneck (
top/htop):- High
%usor%sy? It's likely a CPU issue. - High
%wa? It's likely a disk I/O issue. - Low on
availablememory in the summary? It could be a memory issue.
- High
- Drill Down:
- For I/O issues: Use
iostat -x 1to check disk utilization and latency. Useps auxto look for processes inDstate. - For Memory issues: Use
free -hto confirm memory status andvmstat 1to check for active swapping (si/so). Checkdmesgfor OOM killer messages.
- For I/O issues: Use
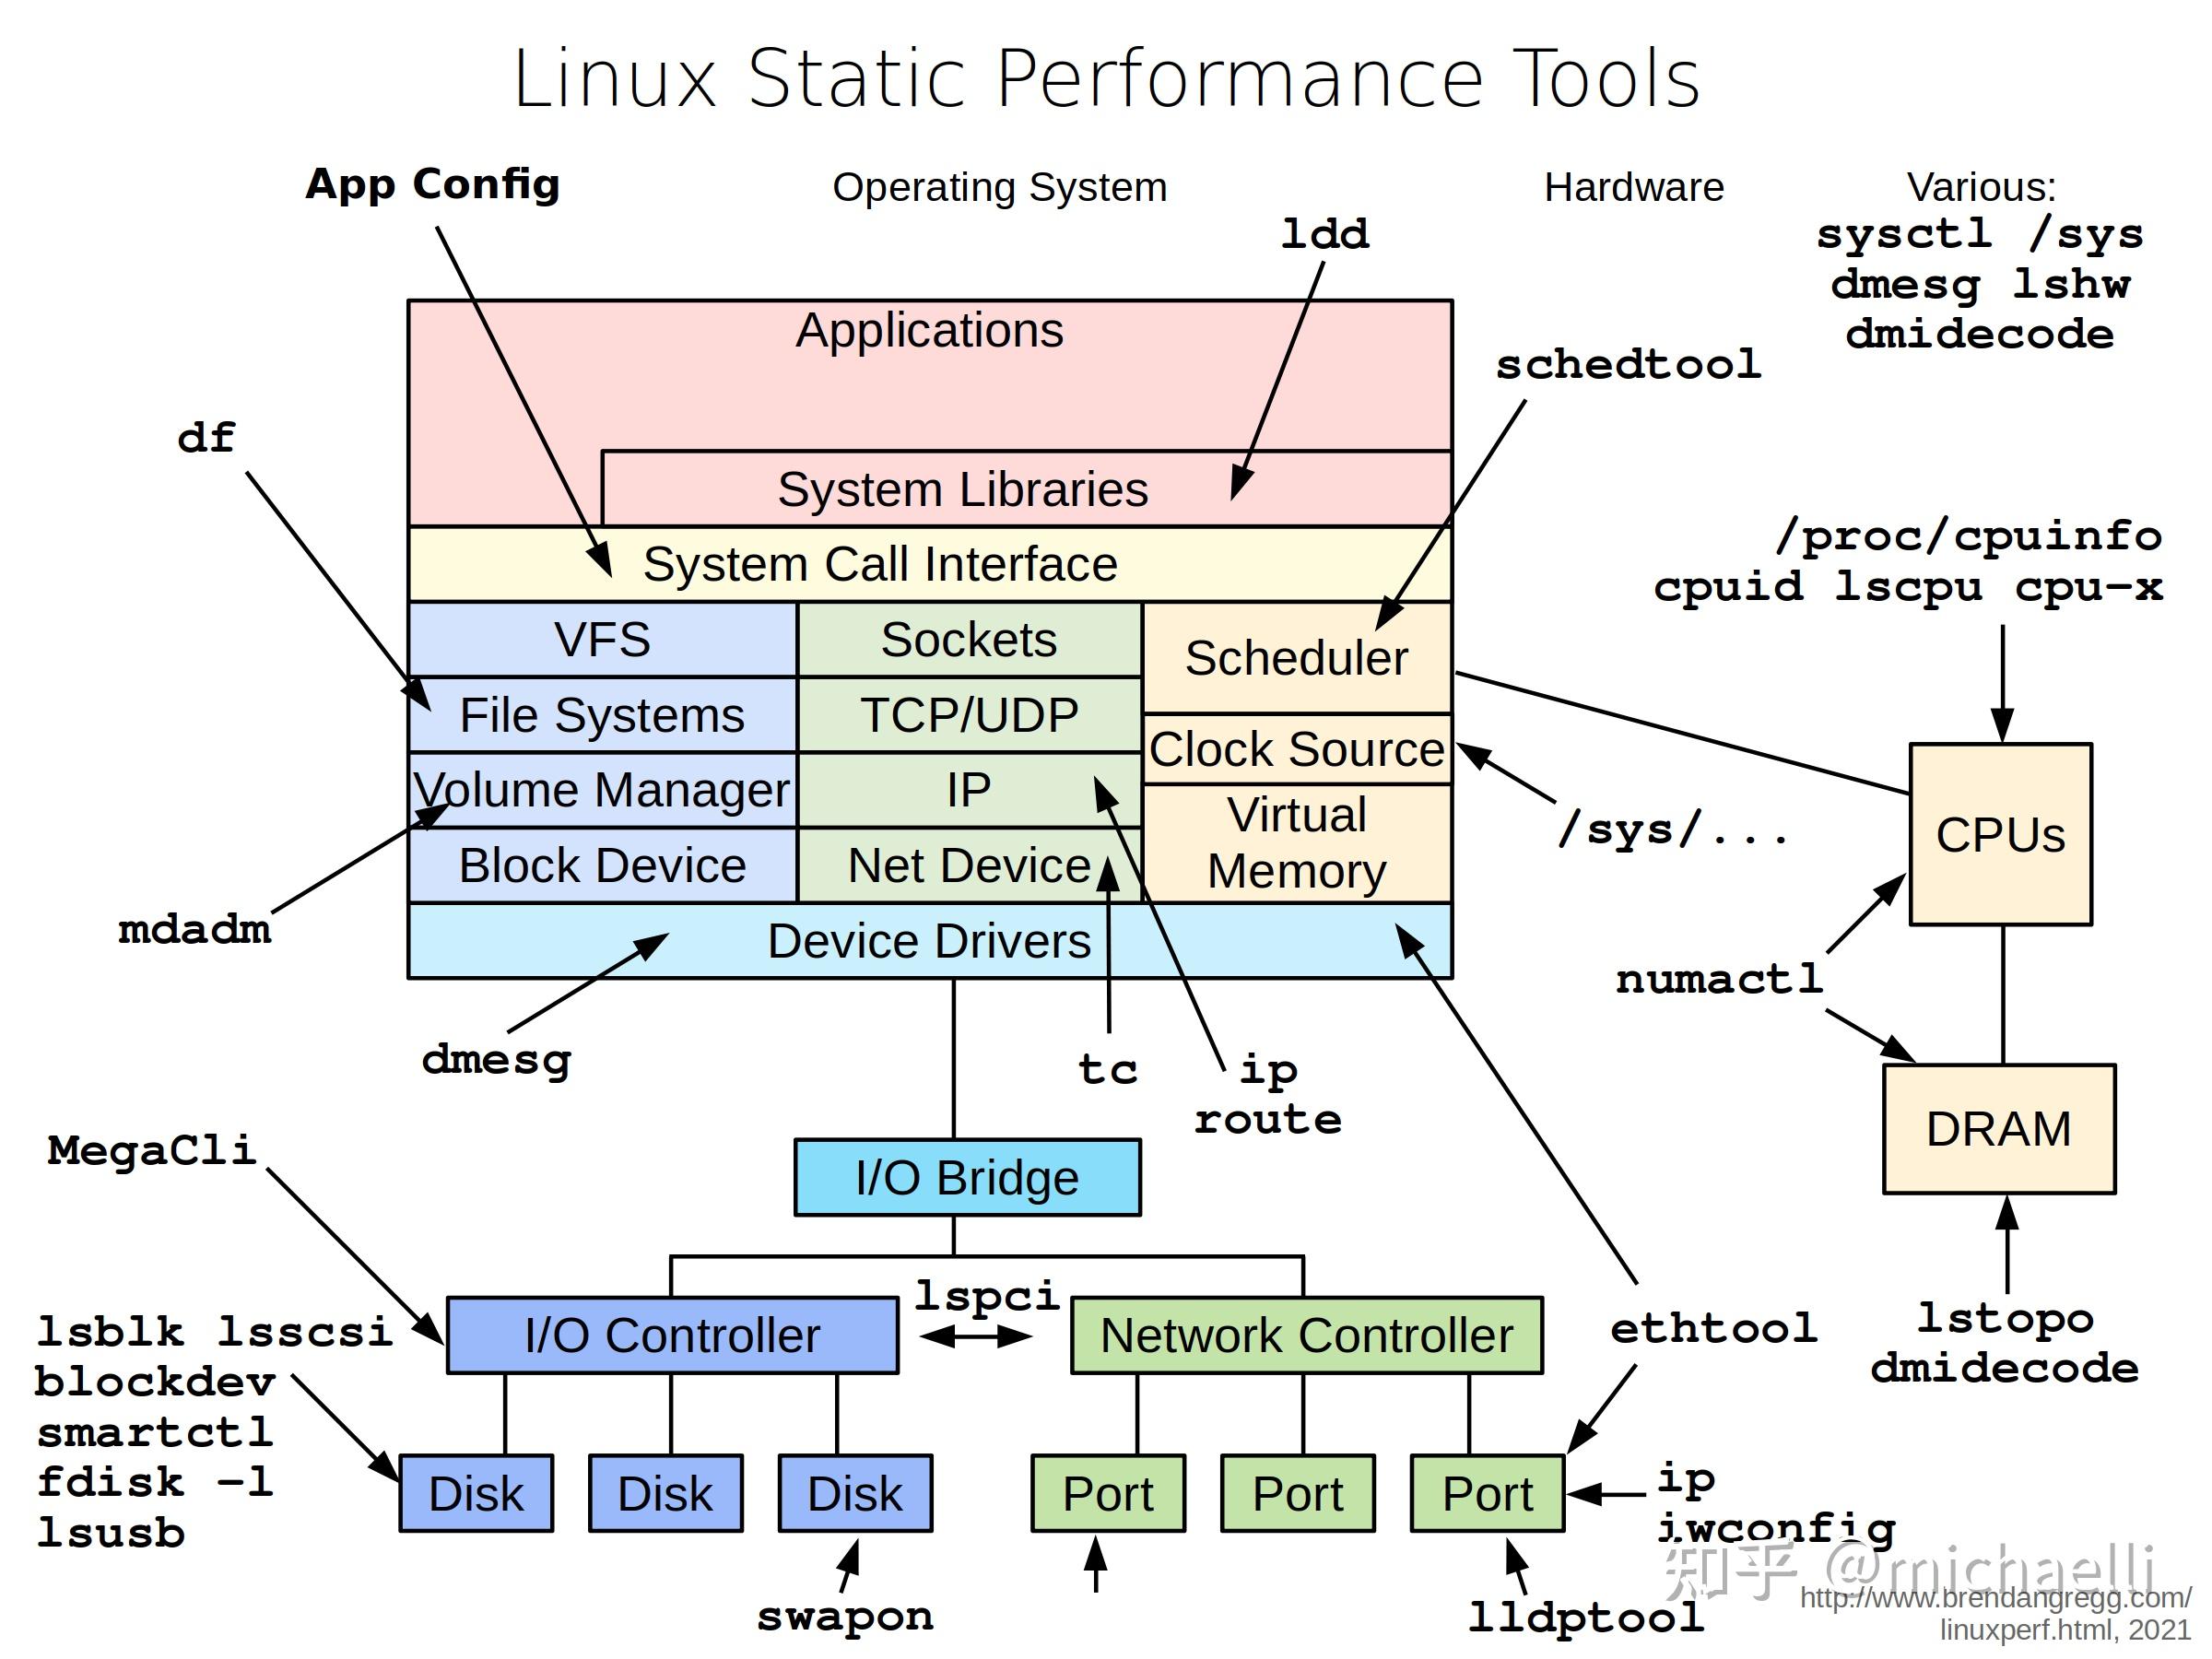
This diagram provides a great mental map of the various tools and which part of the Linux system they help you investigate.
Conclusion
In this lesson, we've established a methodical foundation for troubleshooting system performance. You learned how to distinguish between CPU, memory, and I/O bottlenecks and the primary commands to diagnose each.
Key Takeaways:
- A systematic approach (like the USE method) is crucial for effective troubleshooting.
- CPU Issues: Identified by high
load average(uptime) and high%us/%syintop. - Disk I/O Issues: Indicated by high
%wa(I/O wait) intopand confirmed with high%utilorawaitiniostat. Processes stuck inDstate are a red flag. - Memory Issues: Diagnosed by observing low
availablememory, active swapping (si/soinvmstat), or OOM killer messages indmesg. - The standard workflow is to start broad with
uptimeandtop, then use specialized tools likeiostatandvmstatto confirm your hypothesis.
Preview of the Next Lesson:
We've just learned how to troubleshoot a running system. But what happens when the system doesn't even start properly? In our next lesson, we will identify common boot failure stages and symptoms, preparing you to diagnose and fix problems that occur before you can even get to a login prompt.