Hello! Welcome back to your course on observability.
In our last lesson, we broke down how to articulate the business value of observability for different stakeholders, from developers to the C-suite. You learned to translate technical benefits into strategic impact—a crucial skill for value-based selling. We ended with a preview of the "secret ingredient" that enables much of that deep, specific value: high cardinality.
Today, we will dive into that concept to address the learning outcome: Explain the concept of high cardinality and its impact on observability solutions. Understanding high cardinality is not just a technical detail; it is a fundamental differentiator in the observability market. It's the technical reason why some platforms can deliver on the promise of deep, exploratory debugging while others falter, leading to massive differences in cost, performance, and ultimately, the value a customer receives.
What is High Cardinality?
First, let's define the term. In data, cardinality refers to the number of unique values in a set.
- Low cardinality: A field with a small, predictable number of unique values. For example, an HTTP status metric might have labels for
status_codewith values like200,404,500,503. There are only a few possibilities. - High cardinality: A field with a very large, often unpredictable number of unique values. Think of fields like
user_id,session_id,request_id, orcontainer_id. In a popular application, these can run into the millions or even billions.
To get a solid definition, please start by reading the first part of the following article.
High Cardinality in Metrics: Challenges, Causes, and ...
This article from Sawmill.ai provides a clear and concise definition of cardinality and explains why it becomes a challenge in observability systems.
Read the sections 'What Is High Cardinality?' and 'How Does High Cardinality Escalate Quickly in Metrics?'. Don't worry about the code examples; focus on the concepts they illustrate.
The core issue arises when these high-cardinality attributes are attached as labels or tags to your telemetry data (metrics, logs, traces). Each unique combination of a metric name and its labels creates a unique time series.
Consider this metric: http_requests_total{service="api", region="us-east-1"}. If you add a high-cardinality label like user_id, you get:
http_requests_total{service="api", region="us-east-1", user_id="123"}http_requests_total{service="api", region="us-east-1", user_id="124"}...and millions more...
You've just created millions of unique time series. This problem has become exponentially worse with the shift to modern cloud-native architectures.
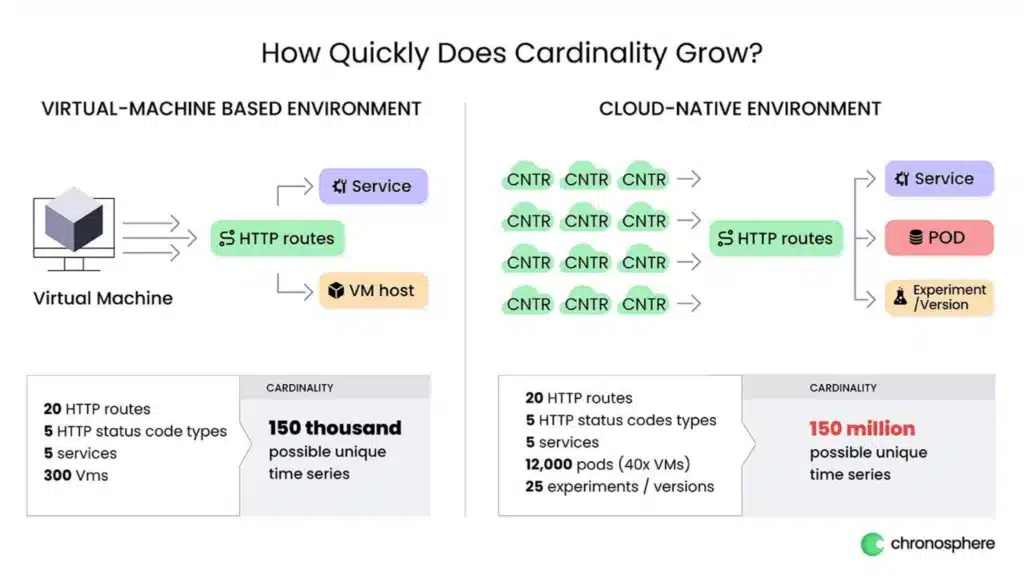
This image illustrates the explosion of cardinality when moving from traditional virtual machine (VM) based architectures to dynamic, cloud-native environments. The number of potential unique time series skyrockets from thousands to millions due to the sheer number of ephemeral components like pods and containers.
As you can see, the move from a few hundred VMs to thousands of ephemeral pods multiplies the cardinality of your system, creating a data explosion that many observability tools are not equipped to handle.
The High-Cardinality Trap: Why It's a Major Problem for Your Customers
High cardinality is not just a technical curiosity; it is the source of significant pain for engineering teams and a major driver of cost. Understanding this pain is critical for your sales conversations. When an observability platform cannot handle high cardinality, it leads to a cascade of failures.
The high-cardinality trap: why your observability platform is ...
This article from ClickHouse, titled 'The high-cardinality trap,' vividly describes the symptoms of a system failing under the load of high-cardinality data. This is excellent material for framing customer pain points.
Read the introduction and the section 'The breaking point: symptoms of a system crippled by high-cardinality data'. Pay close attention to the three symptoms described: glacial query performance, dropped fields, and ingestion bottlenecks. The opening '3 AM' scenario is a powerful narrative to use.
Let's summarize these critical business and technical impacts:
- Massive Cost Increases: Every unique time series needs to be ingested, indexed, and stored. For platforms that price based on data volume or the number of time series, uncontrolled cardinality leads directly to spiraling cloud bills. This is a primary concern for any economic buyer.
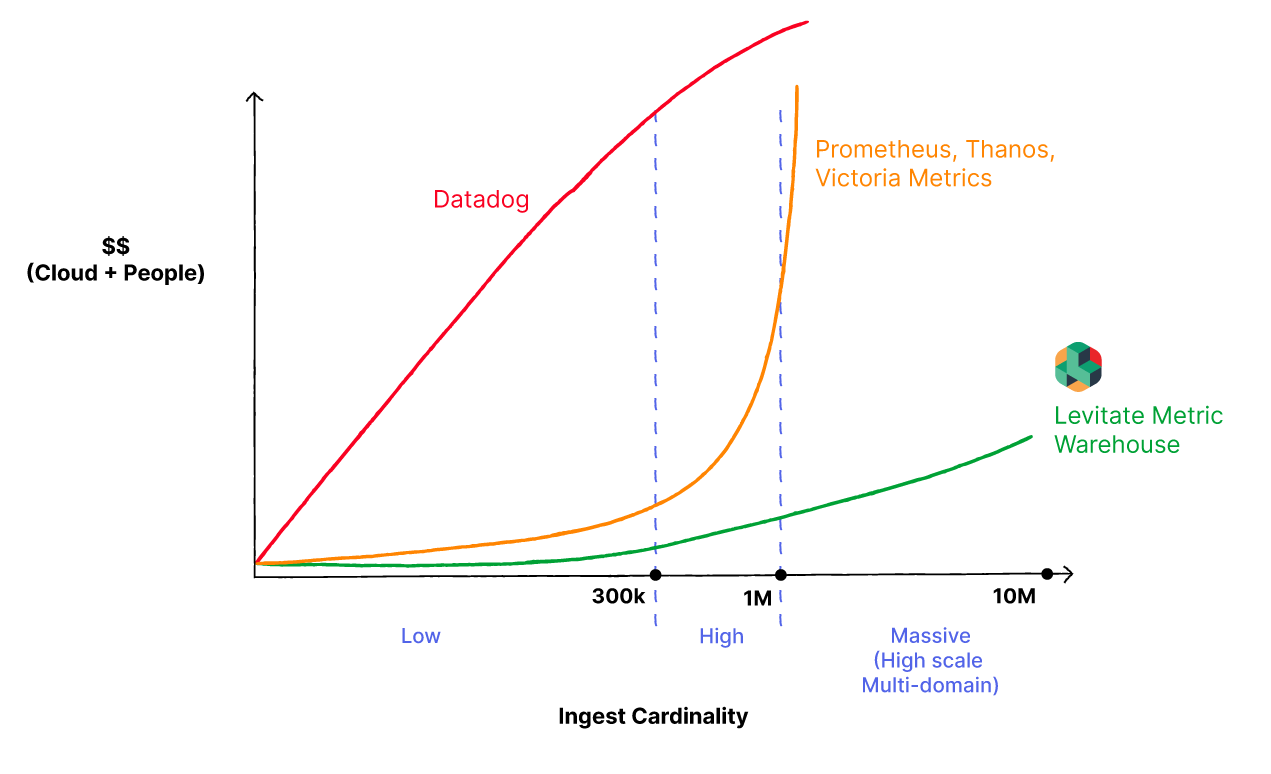
*This graph shows how costs can increase as data cardinality grows for different observability solutions. Solutions not architected for high cardinality see costs rise exponentially, making them financially unsustainable at scale.*
2. Cripplingly Slow Performance: When a developer or SRE tries to run a query (e.g., "show me the error rate for all users in Germany"), the system has to sift through millions or billions of time series. This leads to slow dashboards, query timeouts, and an inability to investigate issues during an outage. This directly increases Mean Time to Resolution (MTTR).
- Forced Compromises & Blind Spots: This is perhaps the most critical impact. To keep their systems from crashing under the load, teams are forced to make painful choices. They intentionally stop collecting high-cardinality data. They drop the
user_id,tenant_id, orrequest_idlabels. While this stabilizes the platform, it creates a massive blind spot. When an issue occurs, they can see that there's a problem, but they have no way of knowing who is affected or tracing the problem back to a specific action. They are flying blind.
The Architectural Divide: Why Traditional Tools Fail
These problems aren't solved by simply adding more servers. They are the result of fundamental architectural limitations in older observability tools. Your ability to explain this positions you as a knowledgeable advisor.
The high-cardinality trap: why your observability platform is ...
The 'high-cardinality trap' article also does an excellent job explaining the 'why' behind these failures. Let's examine the architectural flaws.
Read the section 'Under the hood: the architectural flaw in traditional observability tools'. It explains the 'label-set explosion' in time-series databases like Prometheus and the 'aggregation bottleneck' in search engines like Elasticsearch.
Here is a summary of how different architectures handle—or fail to handle—high cardinality. This is a powerful competitive differentiator.
| Approach | Traditional TSDB (e.g., Prometheus) | Search Engine (e.g., Elasticsearch) | Columnar Database (e.g., ClickHouse, Honeycomb) |
|---|---|---|---|
| Core Architecture | Metric + Label-Set Index | Document Store + Inverted Index | Column-Oriented Storage |
| High-Cardinality Handling | Struggles severely. The "label-set explosion" exhausts memory and crashes the system. | Effective for finding one specific value (like a trace_id), but struggles with aggregations over many unique values, leading to memory errors. |
Handles natively. Adding a high-cardinality dimension is a trivial operation. Aggregations remain fast. |
| Query Performance | Fast for pre-defined, low-cardinality queries. Very slow or impossible for high-cardinality analysis. | Fast for text search. Slow for analytics and aggregations. | Extremely fast for ad-hoc analytical queries on raw, high-cardinality data. |
| Typical Compromise | Drop labels, sample data, pre-aggregate metrics. Creates blind spots. | Expensive hardware, heavy indexing, and short data retention periods. | None required. Retain 100% of unsampled, high-fidelity data. |
(This table is adapted from the ClickHouse article.)
Given your experience with Grafana and Kibana, you've likely seen tools that sit on top of these different architectures. Grafana often visualizes data from TSDBs like Prometheus, while Kibana is the 'K' in the ELK stack, sitting on Elasticsearch. Understanding these underlying databases is key to understanding their limitations.
Test your understanding!
You're on a discovery call with a Director of Engineering. She says, "We use Prometheus for our metrics, and it works fine for our overall CPU and memory monitoring. But my developers are complaining that whenever they try to add custom tags to track performance by feature flag or customer tier, the whole system grinds to a halt. Can you explain why that's happening?"
How would you respond, linking her team's pain to the concept of high cardinality and the architecture of her current tool?
Show answer
Here is a sample response:
"That's a very common challenge, and it points directly to a problem known as high cardinality. Your team is absolutely right to want those tags—tracking performance by customer or feature flag is exactly what modern observability is for.
"The issue isn't what they're trying to do; it's the architectural limitation of the tool they're using. Prometheus, as a traditional time-series database, works great for low-cardinality data like overall CPU usage. But when your team adds a label with many unique values, like a customer_tier or feature_flag_ID, it creates what's called a 'label-set explosion.'
"For every unique customer or flag, Prometheus has to create and manage a brand new time series. This overwhelms the system's memory and indexing capabilities, which is why everything grinds to a halt. To keep the system stable, teams are often forced to remove those valuable tags, leaving them blind to the business context of their performance data.
"Our platform is built on a different type of database—a columnar architecture—that is specifically designed to handle high cardinality without slowing down. This means your developers can add all the business context they need to their data and ask detailed questions without fear of breaking the system."
Conclusion
Today you've explored one of the most important technical concepts in modern observability. A platform's approach to cardinality is not just a feature; it is a fundamental design choice with massive consequences for cost, performance, and a team's ability to actually solve problems.
Key Takeaways:
- High Cardinality is the explosion of unique identifiers (like
user_id,container_id) in modern, distributed systems. - It is a major source of pain, causing runaway costs, slow performance, and forcing engineering teams to drop the very data they need for debugging.
- Traditional observability architectures (Time-Series Databases and Search Engines) were not designed for high cardinality and force painful compromises.
- A platform's ability to handle high cardinality natively is a crucial technical differentiator that unlocks the true value of observability—asking any question of your data and getting a fast answer.
In our next lesson, we will directly connect this concept to a key business metric by focusing on the learning outcome: Describe the relationship between observability and mean time to resolution (MTTR). You'll see precisely how the ability to query high-cardinality data allows teams to slash the time it takes to find and fix problems.