Hello! Welcome back to your journey toward becoming an expert observability SaaS sales executive.
In our last lesson, we investigated the concept of high cardinality. You learned that it's the explosion of unique identifiers in modern systems and that a platform's inability to handle it leads to high costs, slow performance, and critical blind spots. We established that handling high cardinality is a core technical differentiator.
Today, we'll connect that technical capability to a crucial business outcome. We'll address the learning outcome: Describe the relationship between observability and mean time to resolution (MTTR). For a sales executive, this is where the rubber meets the road. MTTR is a language that every engineering leader and business stakeholder understands because it directly translates to cost, revenue, and customer trust. This lesson will equip you to explain precisely how an observability platform turns technical data into faster problem resolution and measurable business value.
What is Mean Time to Resolution (MTTR)?
When a critical service goes down, the clock starts ticking. Every minute of downtime has a real financial cost. According to recent industry data, enterprise downtime can cost anywhere from $5,600 to over $14,000 per minute, and for large organizations, that number can be even higher.
This is where MTTR comes in. It stands for Mean Time to Resolution (or Repair/Recovery) and measures the average time it takes to resolve a failure from the moment it's first detected.
To get a quick introduction to this concept, watch the beginning of this video from IBM Technology.
Application Health Through Observability
This video, 'Application Health Through Observability,' offers a clear definition of the traditional incident response sequence and MTTR.
Watch the clip from 00:13 to 00:44. It defines MTTR in the context of a typical incident lifecycle.
MTTR isn't a single block of time. It's a lifecycle with several distinct stages. Understanding these stages is key to articulating where and how an observability platform can accelerate the process.

As you can see, a significant portion of MTTR is spent simply trying to understand the problem—diagnosing the root cause. This is the phase where teams often lose the most time, and it's where observability delivers the most dramatic improvements.
Why Traditional Approaches Inflate MTTR
If finding the root cause is the goal, why does it often take so long? The answer lies in the common failure patterns that teams fall into, often because their tools are not up to the task. Given your experience with tools like Kibana and Grafana, you may have seen some of these challenges firsthand when teams try to piece together a story from different systems.
To understand these common pitfalls, please read the following article from New Relic. It provides an excellent overview of the problem and the high cost of outages.
From Symptoms to Solutions: Reducing MTTR through error analysis in New Relic
This article, 'Reducing MTTR with error analysis,' details the common traps that increase incident response times. Recognizing these patterns will help you identify customer pain points.
Read the introduction and the section 'Common failure patterns.' Focus on how these issues directly lead to longer resolution times.
The article highlights several key problems that drive up MTTR:
- Siloed Dashboards: Engineers jump between different tools for metrics, logs, and traces, manually trying to correlate timestamps and context. This context-switching is slow and error-prone.
- Chasing Symptoms, Not Causes: An alert tells you what is broken (e.g., error rate is high), but not why. Without a clear path to the root cause, teams are left fighting fires on the surface.
- Data Overload and Noise: "Collect everything" sounds safe, but it often buries the signal in noise, making it harder to find the one piece of data that matters.
- Missing Change Context: Most outages are caused by a change—a new deployment, a feature flag toggle, or an infrastructure update. If this context isn't overlaid with performance data, teams are debugging in the dark.
These issues are a direct consequence of the limitations we discussed in the last lesson. When a platform can't handle high cardinality, teams are forced to use separate, specialized tools and drop the rich context that connects everything. The result is a slow, manual, and frustrating investigation process.
How Observability Slashes MTTR
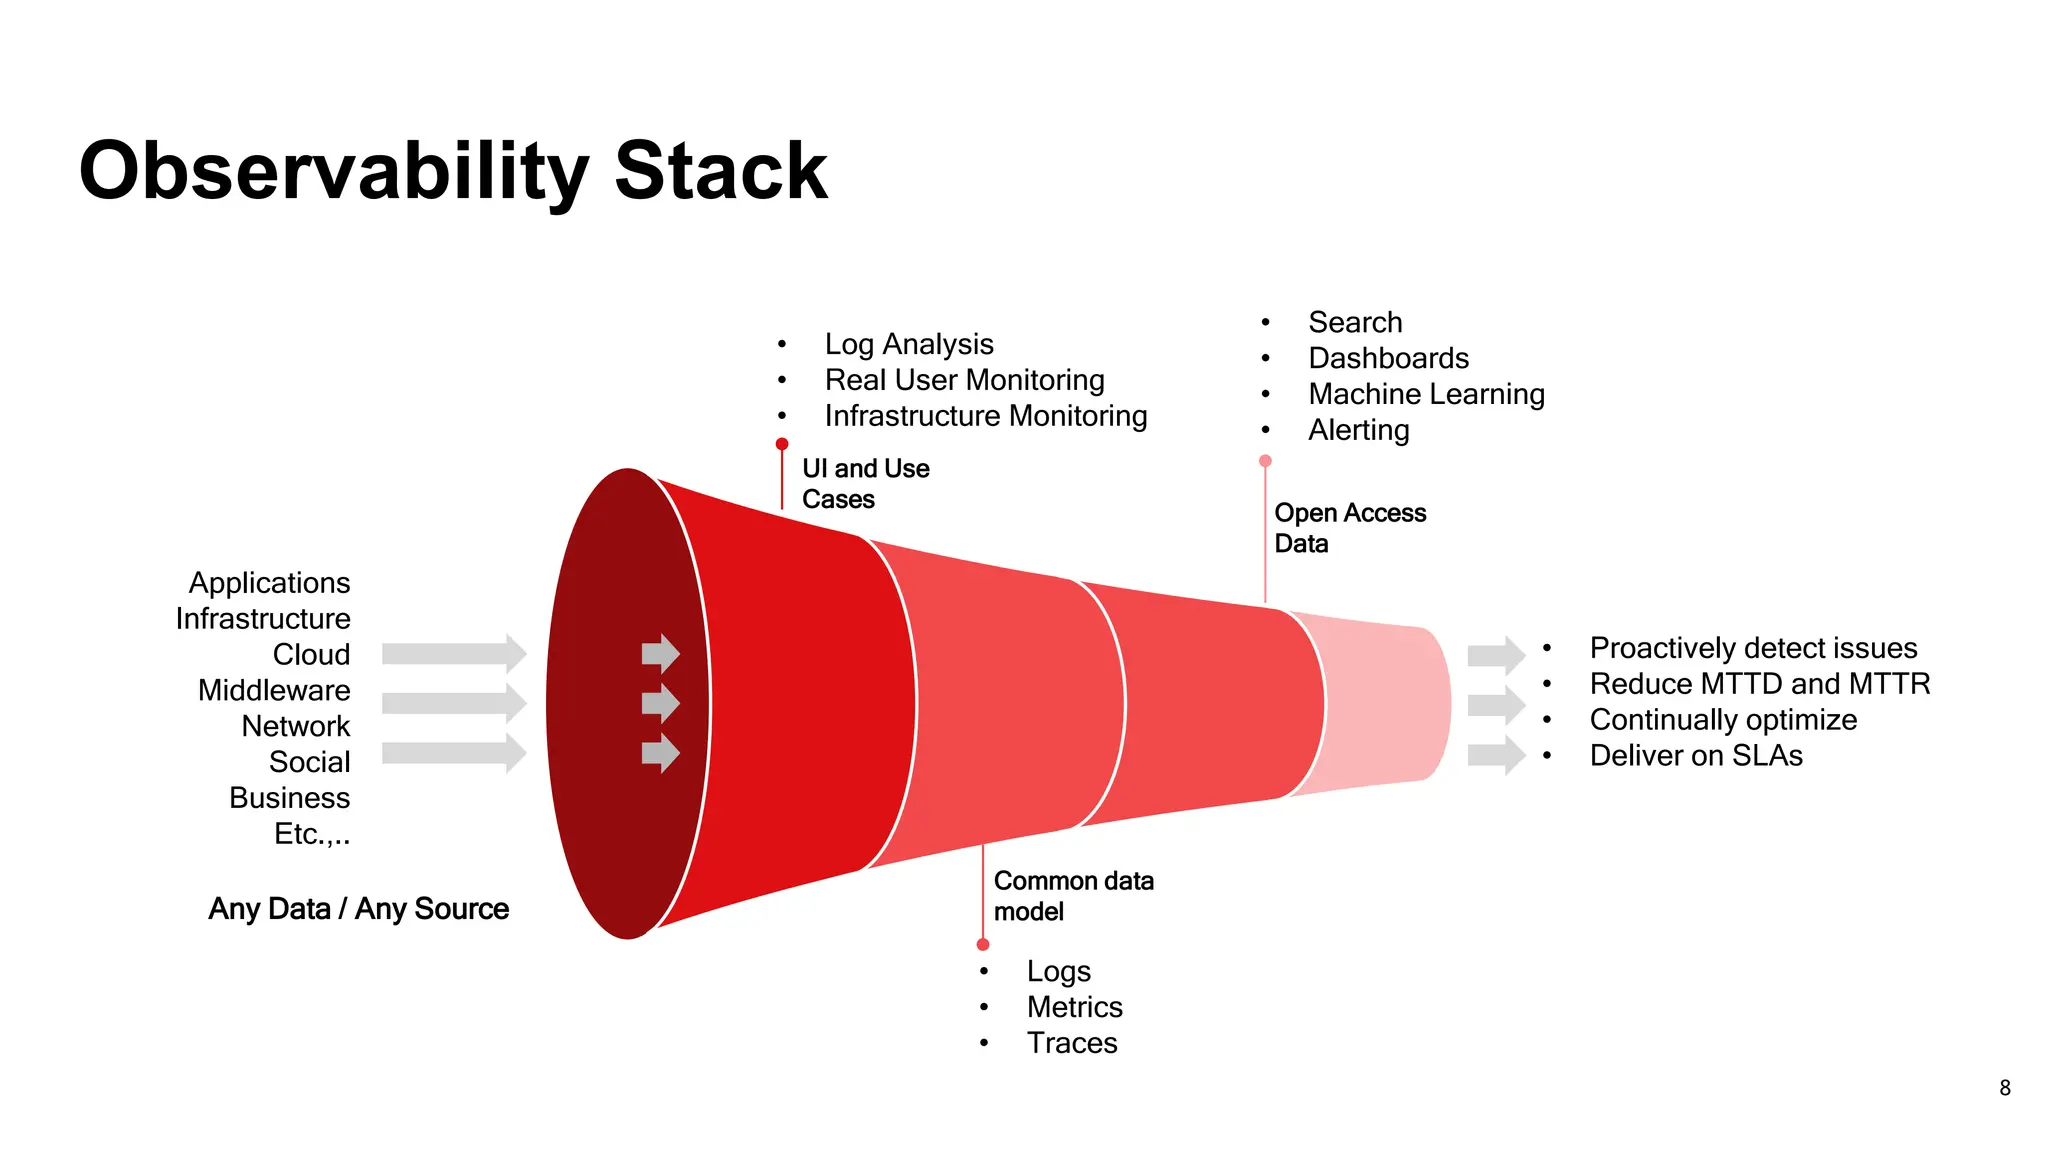
Observability solves this by fundamentally changing the investigation workflow. Instead of providing siloed data points, it weaves metrics, logs, and traces into a single, queryable fabric.
To see how this works, let's explore the core difference between monitoring and observability in the context of reducing MTTR.
Observability vs Monitoring: Key differences, use cases & ...
This article provides a sharp contrast between monitoring and observability, explaining how the correlated telemetry of observability is designed to answer 'why' and reduce MTTR.
Read the section 'Observability vs Monitoring: definitions & a simple mental model' and review the 'Side-by-side' comparison table. Notice how 'MTTR' is explicitly listed as a key performance indicator (KPI) for observability.
The key takeaway is that while monitoring tells you that something is wrong, observability is built to tell you why. It achieves this by enabling a systematic and efficient root-cause analysis process.
A Playbook for Faster Root Cause Analysis
A powerful observability platform enables a repeatable playbook for incident response, turning a chaotic scramble into a structured investigation. The following resource outlines a fantastic, tool-agnostic framework.
From Symptoms to Solutions: Reducing MTTR through error analysis in New Relic
The 'Reducing MTTR...' article we looked at earlier also provides a step-by-step playbook for root cause analysis. This is a practical framework you can use to explain the process to a customer.
Read the sections 'Observability ≠ monitoring: Understanding the difference' and 'Tracing the errors: A step‑by‑step root cause analysis (RCA) playbook.' Focus on the logic of the 'Symptom → Signal → System → Root Cause' framework.
This playbook can be summarized as:
- Symptom: Start with the alert or user report (e.g., "The checkout page is slow").
- Signal: Translate the symptom into a measurable signal (e.g., p99 latency for the
checkout-servicehas spiked). - System: Isolate the system responsible by looking at its dependencies. A service map is invaluable here.
- Root Cause: Drill into the specific system using traces and logs to find the exact line of code, query, or configuration that is failing.
This structured approach, powered by correlated data, allows an engineer to move from a high-level alert to the root cause in minutes, not hours.
Watch this short video to see a simplified version of this diagnostic process in action.
This video, 'SRE Golden Signals Explained,' demonstrates how engineers use key signals to quickly isolate a problem in a microservices environment, explicitly connecting this to reducing MTTR.
Watch from 03:56 to the end. The video shows how monitoring key signals on a dashboard helps isolate a root cause and 'drive down your mean time to resolution.'
Test your understanding!
You're talking to a VP of Engineering. She says, "My teams are spending half their day firefighting. We get an alert that the API is slow, and then it's an all-hands-on-deck scramble through logs on one screen and metrics on another. It takes hours to figure out what's going on."
How would you explain how an observability platform would change this specific workflow to reduce MTTR? Reference at least two of the failure patterns you learned about (e.g., siloed tools, missing context).
Show answer
Here's a sample response:
"That's a situation we hear about constantly, and it points to two classic problems that inflate MTTR: siloed tools and missing context. The 'all-hands-on-deck scramble' you described is a direct symptom of engineers having to manually bridge the gap between their different monitoring systems.
"An observability platform solves this by creating a single source of truth. Instead of starting with an alert and then having to hunt through disconnected logs and metrics, the alert itself would be the entry point into a rich, contextualized investigation.
"For example, when the 'API is slow' alert fires, an engineer could immediately see:
- A distributed trace showing the entire lifecycle of a slow request, pinpointing which downstream service introduced the latency.
- Logs that are automatically correlated to that specific trace, so there's no need to manually search or guess timestamps.
- Deployment markers overlaid on the performance charts, showing if the slowdown coincided exactly with a recent code change.
"By unifying this data, we eliminate the manual correlation and guesswork. Your team can go directly from the symptom to the root cause in a single workflow, turning hours of firefighting into a focused, minutes-long investigation. This directly slashes your MTTR and frees your engineers to work on new features."
Conclusion
In this lesson, you've learned how to connect the technical capabilities of observability to the critical business metric of Mean Time to Resolution. This is a cornerstone of any value-based sales conversation in this space.
Key Takeaways:
- MTTR is a measure of business pain: It represents the direct and indirect costs of system downtime and degraded performance.
- Traditional monitoring inflates MTTR: Siloed tools, data noise, and lack of context force teams into slow, manual investigations.
- Observability is designed to reduce MTTR: By unifying logs, metrics, and traces, it provides the "why" behind any problem.
- A structured RCA playbook, powered by correlated telemetry, allows engineers to move from symptom to root cause with speed and precision.
You are now equipped to explain not just what observability is, but what it does for a business in clear, financial terms.
In our next lesson, we will broaden this perspective. We will build on the concepts of high cardinality and MTTR to address the learning outcome: Identify common customer pain points that observability addresses in SaaS sales conversations. You'll learn to recognize the tell-tale signs of an organization struggling with inadequate tooling and position your solution as the definitive answer to their problems.