Hello! In our last lesson, we explored Gibbs free energy (), the thermodynamic function that tells us whether a reaction is spontaneous (exergonic, ) and where the equilibrium position lies (). Thermodynamics describes the start and end points of a reaction, but it says nothing about the journey between them or, crucially, how fast that journey is. For instance, the conversion of diamond to graphite is highly exergonic, yet it doesn't happen on any human timescale under normal conditions.
This brings us to the domain of kinetics, the study of reaction rates. Today, we will bridge the gap between thermodynamics and kinetics by analyzing reaction coordinate diagrams. These diagrams provide a visual map of the energy changes that occur as reactants transform into products. Your learning outcome is to analyze reaction coordinate diagrams to identify the rate-determining step, intermediates, and transition states.
Given your interest in the link between quantum mechanics and chemical behavior, you'll find that these diagrams are not just cartoons; they are one-dimensional representations of complex, multi-dimensional potential energy surfaces that are often computed using the principles of quantum chemistry.
1. From Potential Energy Surfaces to Reaction Coordinates
A molecule's potential energy is a function of the positions of all its nuclei. For a reaction involving multiple atoms, this creates a high-dimensional landscape called a Potential Energy Surface (PES). A chemical reaction can be visualized as a path across this landscape from a valley corresponding to the reactants to another valley corresponding to the products.
A reaction coordinate diagram simplifies this by plotting the energy along the most probable reaction pathway, known as the Intrinsic Reaction Coordinate (IRC). This is the path of minimum energy connecting reactants and products.
To understand this foundational concept, let's read a brief explanation from the Wikipedia article on Energy Profiles.
Please read the introduction (the first two paragraphs) and the section titled "Reaction coordinate diagrams" (the first paragraph of that section). Focus on how a 1-D reaction coordinate diagram is a projection or slice of a higher-dimensional potential energy surface along the intrinsic reaction coordinate.
2. Anatomy of a Reaction Coordinate Diagram
A reaction coordinate diagram maps the change in Gibbs free energy () as the reaction progresses. Let's dissect its key features.
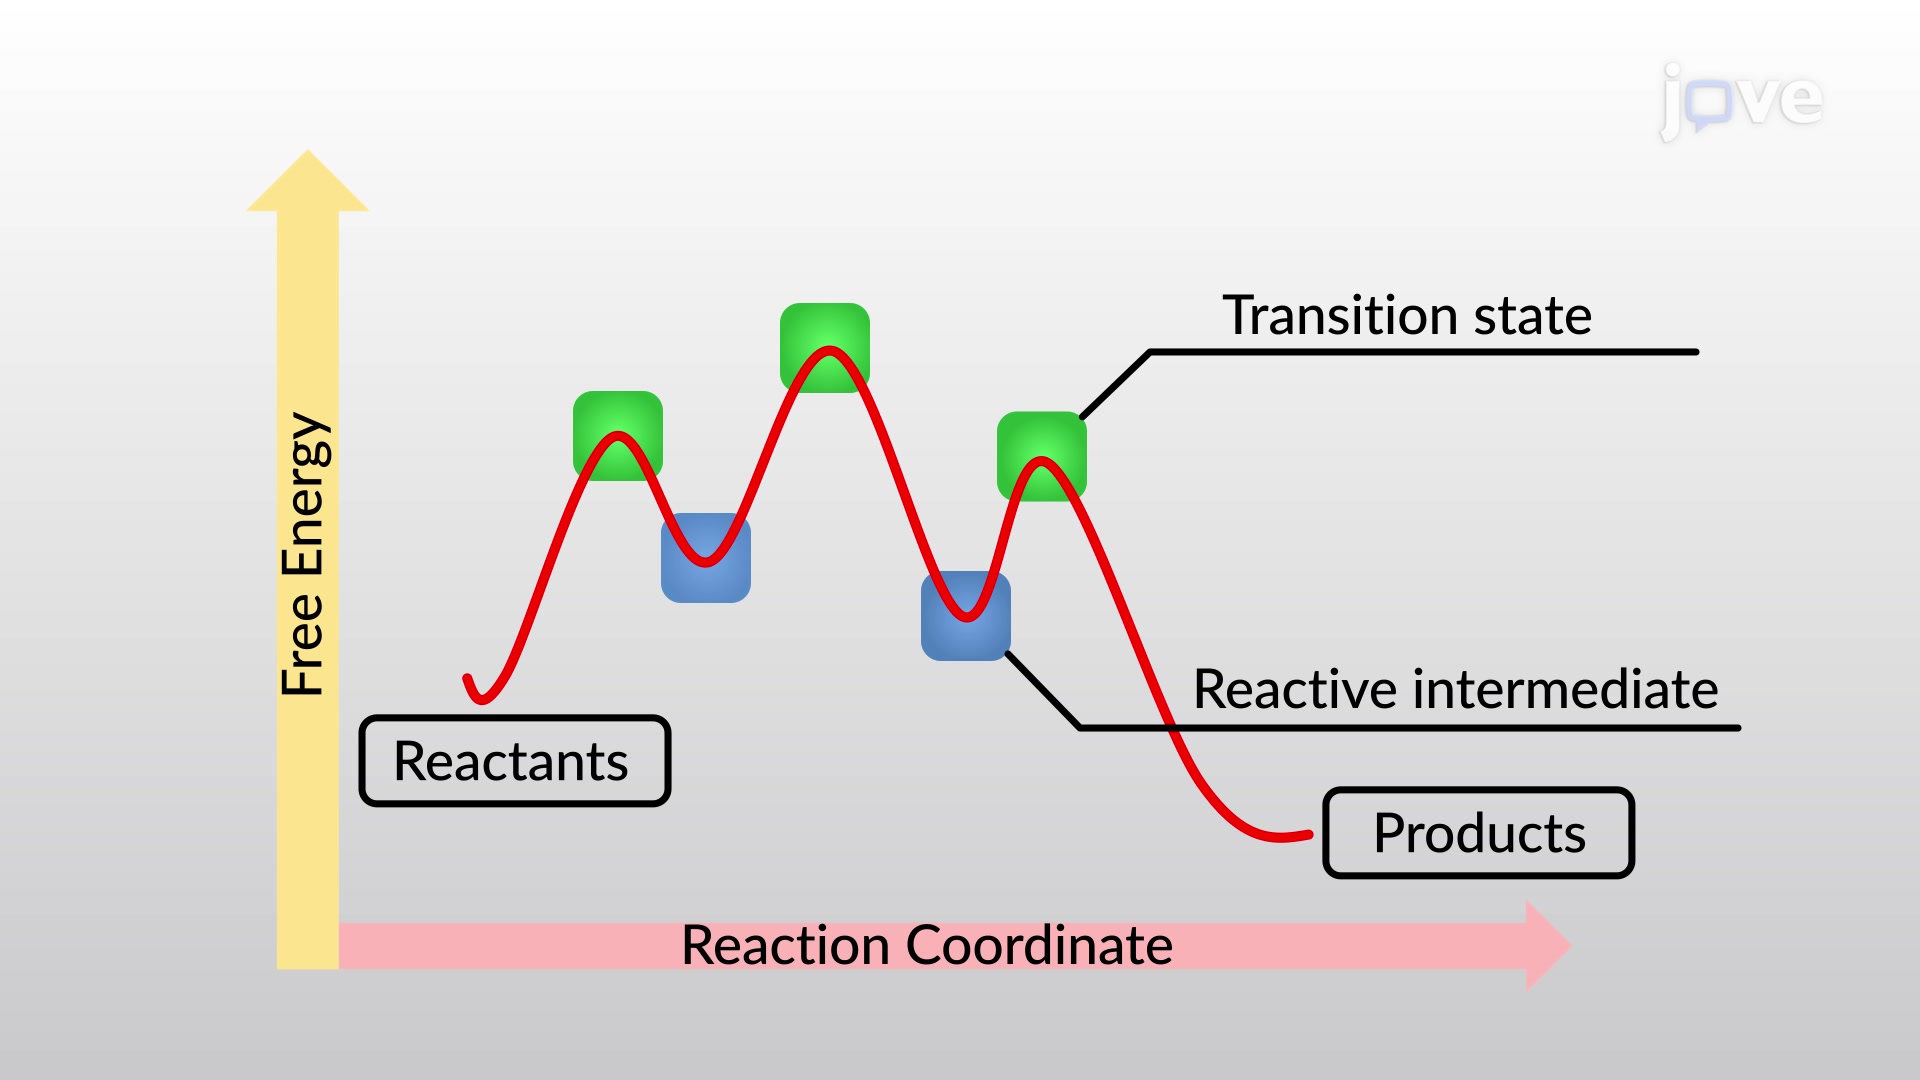
Transition States vs. Intermediates
This is one of the most critical distinctions in reaction kinetics.
-
Transition State (TS or ‡): A transition state is the point of maximum energy along the reaction coordinate for an elementary step. It is not a molecule. It is a fleeting, unstable arrangement of atoms where old bonds are partially broken and new bonds are partially formed. It exists for only the duration of a single bond vibration (~10⁻¹³ s) and can never be isolated. From a mathematical standpoint, a transition state is a first-order saddle point on the potential energy surface—a maximum along the reaction coordinate but a minimum in all other directions.
-
Intermediate: An intermediate is a chemical species that is formed in one step and consumed in a subsequent step. It corresponds to a local energy minimum—a valley—on the reaction coordinate diagram. Because it sits in an energy well, an intermediate has a finite lifetime and, in principle, can be detected or even isolated under certain conditions.
Difference between intermediates and transition states
The distinction between these two concepts is crucial. The following discussion on Chemistry Stack Exchange provides excellent, clear definitions, including a look at the underlying mathematics.
Read the answers by users 'CCR' and 'Tyberius'. Pay close attention to the definitions of an intermediate as a 'minimum on the potential energy surface' and a transition state as a 'saddle point'. The explanation of how these are identified computationally using the Hessian matrix will be of particular interest to you.
Activation Energy ()
The Gibbs free energy of activation, denoted , is the energy difference between the reactants and the highest-energy transition state of a given step. This is the minimum energy required for the reactants to overcome the energy barrier and proceed to products.
- High : Large energy barrier → Slow reaction rate.
- Low : Small energy barrier → Fast reaction rate.
The relationship between the rate constant () and activation energy is described by the Eyring equation from Transition State Theory (TST), which you might find particularly interesting as it connects macroscopic rates to the molecular properties of the transition state.
Thermodynamic Interpretation of Transition State Theory: The Eyring Equation
This video from LearnChemE gives a superb overview of Transition State Theory and the Eyring equation. It provides the deep theoretical justification for why the activation energy is so central to kinetics.
Watch from 01:56 to 07:34. The video explains the core assumption of TST (an equilibrium between reactants and the transition state) and then derives the Eyring equation. Focus on the final result, which shows that the rate constant k is exponentially dependent on -ΔG‡/RT.
The key takeaway is that the rate of a reaction is exponentially sensitive to the height of the activation barrier. This is the quantitative "why" behind the importance of transition state energy.
3. Multi-Step Reactions and the Rate-Determining Step
Many organic reactions do not occur in a single step. A reaction that involves one or more intermediates is a multi-step or complex reaction. Its reaction coordinate diagram will have multiple peaks (transition states) and valleys (intermediates).
In such a reaction, one step is typically much slower than all the others. This slowest step acts as a bottleneck and governs the overall speed of the reaction. It is called the Rate-Determining Step (RDS) or Rate-Limiting Step.
How to identify the RDS on a reaction coordinate diagram:
The rate-determining step is the elementary step with the transition state of highest free energy relative to the initial reactants.
Let's watch a clear visualization of a two-step reaction profile that explains how to identify the rate-determining step.
Watch from 06:55 to 08:57. The video shows the Gibbs energy profile for a two-step reaction (an SN1 reaction, which we will study later). Notice how the first step has a larger Gibbs energy of activation (ΔG‡) than the second. Therefore, the first step is the slow, rate-determining step.
Test your understanding!
Consider the reaction coordinate diagram shown earlier (the LINK image).
- How many elementary steps are in this reaction? How many intermediates are formed?
- Is the overall reaction (A → D) exergonic or endergonic?
- Which step is the rate-determining step?
Show answer
- There are three energy barriers (TS1, TS2, TS3), so there are three elementary steps. There are two energy valleys between the reactants and products, corresponding to intermediates B and C. So, there are two intermediates.
- The product (D) is at a lower free energy than the reactant (A). Therefore, is negative, and the reaction is exergonic.
- To find the RDS, we compare the energy of each transition state to the starting reactant (A).
- The barrier for the first step is the energy of TS1 minus the energy of A.
- The barrier for the second step is the energy of TS2 minus the energy of A.
- The barrier for the third step is the energy of TS3 minus the energy of A.
By visual inspection, TS2 is the highest point on the entire energy profile. The energy difference between A and TS2 is the largest activation barrier in the entire process. Therefore, the second step (B → C) is the rate-determining step.
Conclusion
You are now able to dissect a reaction coordinate diagram and extract a wealth of information about the mechanism and kinetics of a reaction.
Key Takeaways:
- Reaction coordinate diagrams are 1D slices of a quantum mechanical potential energy surface that show the free energy change along the reaction pathway.
- Transition states are high-energy, non-isolable saddle points on the energy profile, representing the peak of an energy barrier.
- Intermediates are local energy minima, corresponding to real, albeit often short-lived, chemical species formed during a reaction.
- The activation energy () is the energy barrier from reactant to transition state; it determines the reaction rate.
- In a multi-step reaction, the rate-determining step is the one with the highest-energy transition state relative to the starting material.
Preview of the Next Lesson:
We know that the transition state's energy determines the reaction rate, but what determines the transition state's energy? Its structure. While we can't observe a transition state directly, we can infer its structure. In the next lesson, we will introduce Hammond's postulate, a powerful principle that allows us to approximate the structure and energy of a transition state by relating it to the stable species (reactant, intermediate, or product) that it is closest to in energy. This will be our first step in learning to predict, and not just analyze, reaction rates.