Hello! Welcome to your third lesson.
In our last two lessons, we established the numerical foundations for describing a dataset. We learned how to calculate measures of central tendency (like the mean) to find a representative value, and measures of dispersion (like the standard deviation) to quantify the precision or spread of our data.
While these numbers are essential, they don't give us the full picture. Today, we'll move from numerical summaries to visual ones. This lesson addresses the learning outcome: Construct and interpret histograms and box plots for visualizing data distributions. These graphical tools allow you to intuitively grasp the center, spread, and shape of your experimental data all at once, providing insights that numbers alone can miss.
1. Histograms: Visualizing the Shape of Your Data
Imagine you have 100 measurements of nanoparticle diameters from a synthesis batch. Simply listing the numbers or calculating a mean and standard deviation doesn't reveal the full story. Is the distribution of sizes symmetric? Are there two distinct populations of sizes (bimodal)? Is the data skewed towards larger or smaller particles?
A histogram answers these questions by grouping data into "bins" and plotting the frequency of measurements in each bin.
To get a clear, intuitive understanding of how histograms work, please watch the following video.
StatQuest: Histograms, Clearly Explained
This video from StatQuest provides a clear, conceptual explanation of what a histogram is, why it's useful, and how to interpret its shape.
Please watch from the beginning (00:00) to 02:12. Focus on how the process of 'binning' helps to visualize the underlying distribution of the data.
The Critical Importance of Bin Width
As the video hinted, the most important decision you make when creating a histogram is choosing the bin width. An inappropriate bin width can obscure important features or even create misleading patterns.
- Too wide: Oversimplifies the distribution, hiding features like multiple peaks.
- Too narrow: Creates a noisy, jagged plot where it's hard to see the underlying trend.
Let's continue with the same video to see a demonstration of this effect.
StatQuest: Histograms, Clearly Explained
This part of the video clearly demonstrates how changing the bin width can drastically alter the appearance and interpretation of a histogram.
Please watch from 02:12 to 03:23. Notice how the same dataset can look completely different depending on the bin settings. This is a crucial practical point when using software to plot your data—never blindly accept the default settings.
The key takeaway is that you should always experiment with different bin widths to ensure the visualization accurately reflects your data's structure.
2. Box Plots: A Five-Number Summary
While histograms are great for seeing the detailed shape of a single distribution, box plots (or box-and-whisker plots) provide a more condensed summary. They are exceptionally useful for comparing multiple datasets at a glance, a common task when evaluating different experimental conditions or analytical methods.
A box plot is constructed from five key statistical values:
- Minimum: The lowest value in the dataset (excluding outliers).
- First Quartile (Q1): The 25th percentile. 25% of the data falls below this value.
- Median (Q2): The 50th percentile, which we've previously discussed as a measure of central tendency.
- Third Quartile (Q3): The 75th percentile. 75% of the data falls below this value.
- Maximum: The highest value in the dataset (excluding outliers).

The Interquartile Range (IQR = Q3 - Q1) is a robust measure of spread, similar to the standard deviation we covered in the last lesson. Because it focuses on the middle 50% of the data, it is less affected by extreme values.
Constructing and Interpreting a Box Plot
The following video provides a step-by-step guide on how to calculate the necessary values and construct a box plot from a raw dataset.
How To Make Box and Whisker Plots
This tutorial from The Organic Chemistry Tutor demonstrates the entire process of creating a box plot, from ordering the data and finding quartiles to drawing the final plot.
Please watch from the beginning (00:00) to 07:14. Pay close attention to how the quartiles are found and how the IQR is calculated. The video also introduces the rule for identifying outliers, which will be the focus of our next lesson.
As the video explained, a key function of box plots is to flag potential outliers. The standard rule is to define the "whiskers" of the plot as extending to the furthest data points that are within 1.5 times the IQR from the edges of the box (Q1 and Q3). Any data point that falls outside of this range is plotted as an individual point and considered a potential outlier. We will explore this in more detail in the next lesson.
3. Histograms vs. Box Plots: Choosing the Right Tool
So, when should you use a histogram, and when is a box plot more appropriate? They are complementary tools that answer different questions.
- Use a histogram when you want to understand the detailed shape, skewness, and modality (number of peaks) of a single dataset.
- Use a box plot when you want to concisely summarize a dataset or, more importantly, compare the distributions of several datasets side-by-side.
The image below shows how three different datasets are represented by both histograms and box plots.
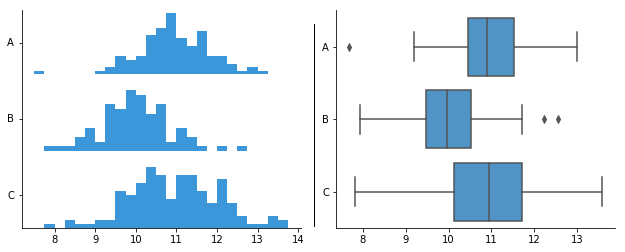
Notice how the box plots make it very easy to compare the medians (the line in the box), the spread (the height of the box), and the presence of outliers across the three groups. Trying to overlay the three histograms would be visually cluttered and much harder to interpret.
For further reading on the roles and interpretation of these plots, you can review the following text.
Data Visualization Guide: Histograms, Box Plots & Scatter Plots
This guide provides excellent summaries of what histograms and box plots reveal about your data and offers clear advice on when to use each.
Read the sections titled 'Histograms: Understanding Distributions', 'Box Plots: Summarizing Key Statistics', and 'Choosing the Right Visualization'. These sections will reinforce the concepts from the videos and solidify your understanding of their comparative strengths.
4. Practice Problem
Let's apply these concepts. In your lab, you are comparing two purification methods for a synthesized compound. You run five replicates for each method and measure the final purity (%).
- Method A (% Purity): 98.5, 98.7, 99.0, 99.1, 99.2
- Method B (% Purity): 95.2, 98.4, 98.6, 98.8, 100.0
For Method B, calculate the five-number summary and the IQR. Would any points be flagged as outliers by the 1.5xIQR rule? Based on the summary statistics, how might a box plot for Method B differ from a box plot for Method A?
Click to see the solution and interpretation.
Analysis of Method B:
-
Order the data: 95.2, 98.4, 98.6, 98.8, 100.0
-
Find the Five-Number Summary:
- Minimum: 95.2
- Median (Q2): The middle value is 98.6.
- First Quartile (Q1): The median of the lower half (95.2, 98.4) is (95.2 + 98.4) / 2 = 96.8.
- Third Quartile (Q3): The median of the upper half (98.8, 100.0) is (98.8 + 100.0) / 2 = 99.4.
- Maximum: 100.0
-
Calculate IQR and check for outliers:
- IQR: Q3 - Q1 = 99.4 - 96.8 = 2.6.
- Lower Bound for outliers: Q1 - 1.5 * IQR = 96.8 - 1.5 * 2.6 = 96.8 - 3.9 = 92.9.
- Upper Bound for outliers: Q3 + 1.5 * IQR = 99.4 + 1.5 * 2.6 = 99.4 + 3.9 = 103.3.
Since all data points for Method B (from 95.2 to 100.0) fall within the range [92.9, 103.3], there are no outliers flagged by this rule.
Comparison and Interpretation:
- Method A (for comparison): Median = 99.0, IQR = 99.15 - 98.6 = 0.55.
- Central Tendency: The median purity of Method A (99.0) is slightly higher than Method B (98.6).
- Dispersion: The IQR for Method B (2.6) is much larger than for Method A (0.55). This indicates that the results from Method B are far more spread out and less precise.
- Shape/Skew: For Method B, the median (98.6) is closer to Q3 (99.4) than to Q1 (96.8), and the range of data below the median (98.6 - 95.2 = 3.4) is larger than the range above (100.0 - 98.6 = 1.4). This suggests the distribution is negatively skewed (or left-skewed), with a tail towards the lower purity values. A box plot for Method B would have a longer lower whisker. In contrast, Method A's data is more symmetric.
If you were to plot these as two side-by-side box plots, you would immediately see that Method A is not only slightly better on average (higher median) but also far more consistent (smaller box and shorter whiskers).
Conclusion
You have now learned how to construct and interpret two of the most fundamental data visualization tools in science and statistics.
Key Takeaways:
- Histograms are excellent for visualizing the detailed shape, center, and spread of a single continuous variable. The choice of bin width is critical for accurate interpretation.
- Box plots provide a compact summary based on five key numbers (min, Q1, median, Q3, max). They are ideal for comparing distributions across multiple groups and flagging potential outliers.
- The Interquartile Range (IQR) is a robust measure of spread used in box plots.
In this lesson, we introduced the concept of identifying outliers using the 1.5xIQR rule. In our next lesson, we will dedicate our full attention to this topic: Identify potential outliers in analytical data using box plots and the IQR rule. We will formalize this process and then learn a statistical test to help confirm if an apparent outlier should be retained or rejected.