Hello! Welcome to your second lesson.
In our first lesson, we explored how to find a single representative value for a dataset using measures of central tendency like the mean and median. We saw that the mean concentration of a set of replicate samples gives us an idea of the "true" value, but it doesn't tell the whole story.
Today, we'll address the other crucial aspect of describing data: its variability. This lesson addresses the learning outcome: Calculate and interpret measures of dispersion (range, variance, and standard deviation) for experimental data. You will learn how to quantify the precision of your measurements—a concept fundamental to all work in analytical and materials chemistry.
1. Why Dispersion Matters: Visualizing Precision
Imagine you're comparing two different methods for synthesizing a nanoparticle. Both methods produce particles with a mean diameter of 100 nm. Are the methods equivalent? Not necessarily. One method might produce particles that are all very close to 100 nm, while the other might produce a wide mix of sizes, from 50 nm to 150 nm, which just happens to average out to 100 nm.
This "spread" or "dispersion" of data is a measure of precision. In experimental science, high precision (low dispersion) means your results are reproducible and have minimal random error.
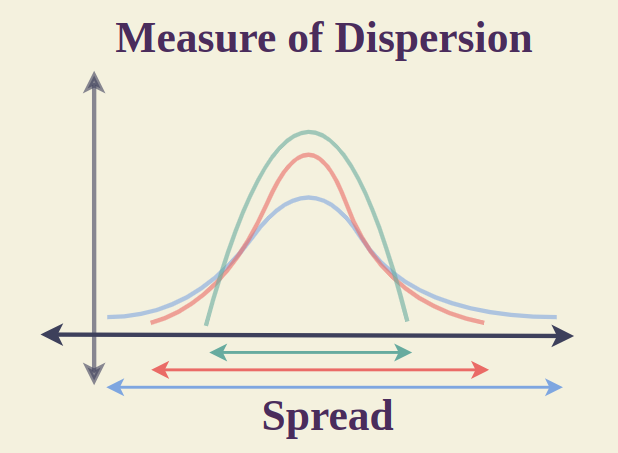
We will now look at the three primary ways to quantify this dispersion: range, variance, and standard deviation.
2. Conceptual Overview of Dispersion Measures
Let's begin with a conceptual introduction to these measures. The following video explains why dispersion is important and provides a clear, high-level definition of range, variance, and standard deviation.
Descriptive Statistics: FULL Tutorial - Mean, Median, Mode, Variance & SD (With Examples)
This video introduces the concept of dispersion and what it tells us about a dataset. It provides an excellent intuitive feel for each measure before we dive into the calculations.
Please watch from 07:10 to 11:41. Focus on how dispersion provides context for the mean and helps you understand how clustered or scattered the data points are.
As the video explained:
- Range: The simplest measure, showing the total span of your data.
- Variance: A more sophisticated measure of the average squared distance of each data point from the mean.
- Standard Deviation: The square root of the variance, which is particularly useful because its units are the same as the original data and the mean.
3. Calculating Variance and Standard Deviation
Now, let's focus on the practical calculations. It's important to distinguish between calculating these measures for an entire population versus a sample drawn from that population. In experimental work, you are almost always working with a sample (e.g., 5-10 replicates), not the infinite population of all possible measurements. This distinction affects the formula we use.
The following video provides a clear, step-by-step guide to the calculations and highlights the difference between the population and sample formulas.
Standard Deviation Formula, Statistics, Variance, Sample and Population Mean
This tutorial from The Organic Chemistry Tutor walks through the formulas and calculations for standard deviation. Pay close attention to the distinction between the population (dividing by N) and sample (dividing by n-1) formulas.
Watch from the beginning to 09:36. The video will cover both formulas, provide a visual for what standard deviation represents, and work through two complete examples. It also clarifies the relationship between variance and standard deviation.
The key takeaway from the video is the denominator in the formula:
- For a population, we divide the sum of squared differences by .
- For a sample, we divide by .
In your work, you will almost exclusively use the sample standard deviation, :
The use of (known as the degrees of freedom) provides what is called an "unbiased estimate" of the true population standard deviation. It's the scientifically rigorous approach for sample data.
4. Application in Analytical Chemistry: Relative Standard Deviation
While the standard deviation () is a measure of absolute precision, in chemistry we often need to compare the precision of different experiments. For this, we use the relative standard deviation (RSD), typically expressed as a percentage (%RSD). It contextualizes the spread of the data relative to its mean.
A low %RSD (e.g., <1-5% in many applications) is a common benchmark for good analytical precision.
The following reading, from a textbook on analytical chemistry, formalizes these concepts in a familiar context and demonstrates their calculation.
Characterizing Measurements and Results
This text from Chemistry LibreTexts provides the formal definitions and formulas for measures of spread as used in a chemical context. It introduces the crucial concept of Relative Standard Deviation (RSD).
Please read the section titled 'Measures of Spread', which includes subsections on 'Range', 'Standard Deviation', and 'Variance'. Pay special attention to the formulas for the sample standard deviation (s) and the relative standard deviation (s_r). The worked examples using penny mass and sodium concentration in serum are highly relevant.
5. Practice Problem
Let's apply what you've learned. Imagine you are developing an analytical method to determine the concentration of a compound in a standard solution known to be 50.0 mg/L. You test two different sample preparation procedures and obtain the following replicate measurements:
- Procedure A (mg/L): 49.8, 50.1, 49.9, 50.3, 49.9
- Procedure B (mg/L): 48.5, 51.5, 52.0, 48.0, 50.0
For each procedure, calculate:
- The mean ()
- The range ()
- The sample standard deviation ()
- The percent relative standard deviation (%RSD)
Based on your results, which procedure is more precise? Why?
Solution Guide:
Click to see the calculations and interpretation.
Procedure A:
- Mean:
- Range:
- Sample Standard Deviation:
- Sum of squared differences:
- Variance:
- Standard Deviation:
- %RSD:
Procedure B:
- Mean:
- Range:
- Sample Standard Deviation:
- Sum of squared differences:
- Variance:
- Standard Deviation:
- %RSD:
Interpretation:
Procedure A is significantly more precise than Procedure B. Although both procedures have the same mean (they are equally accurate in this case, as the mean matches the true value), the much smaller standard deviation and %RSD for Procedure A indicate that its results are more consistent and have less random error.
Conclusion
In this lesson, you learned how to quantify the spread, or precision, of your experimental data. This is a vital skill for evaluating the quality of an analytical method, comparing results, and understanding sources of error.
Key Takeaways:
- Measures of dispersion—range, variance, and standard deviation—quantify the precision of a dataset.
- The range is a quick but limited indicator of spread.
- Standard deviation is the most common measure of dispersion, representing the average distance of data points from the mean.
- In experimental science, always use the sample standard deviation formula, which divides by .
- Relative Standard Deviation (RSD) allows for the comparison of precision between different experiments, which is essential in method validation and development.
In our next lesson, we will combine the concepts of central tendency and dispersion by learning how to visualize data distributions using histograms and box plots. These graphical tools will allow you to see the center, spread, and shape of your data all at once.