Hello! Welcome to your first lesson.
This course is designed to build a solid foundation in statistics, leading to an expert understanding of Design of Experiments (DoE) tailored for your work in chemistry. We'll start from the very beginning to ensure all the fundamentals are clear, but we will consistently link the concepts back to practical applications in analytical chemistry and materials science.
Today, we begin Module 1, which focuses on the essential first step of any data analysis: summarizing and visualizing your data. Your learning outcome for this lesson is to be able to select and interpret appropriate measures of central tendency (mean, median, and mode) based on data characteristics.
When you run an experiment, you often collect multiple data points. For example, you might measure the absorbance of a solution five times, or test the tensile strength of ten samples of a new material. The first question is always, "What is a single, typical value that can represent this set of measurements?" This lesson will equip you to answer that question rigorously.
1. What is Central Tendency?
Let's begin by building an intuition for why we need to find the "center" of a dataset. The following video provides an excellent, engaging overview of the three primary ways we measure this: the mean, the median, and the mode.
Mean, Median, and Mode: Measures of Central Tendency: Crash Course Statistics #3
This video from CrashCourse introduces the concept of central tendency and explains the purpose of the mean, median, and mode as summary statistics.
Please watch the entire video (it's about 10 minutes). Pay attention to the examples used to illustrate how each measure can tell a different story about the same data, especially the discussion on outliers and skewed data.
As the video explained, measures of central tendency give us a single value to summarize a distribution of data. Each one—mean, median, and mode—has its own strengths and weaknesses.
- The mean is the arithmetic average.
- The median is the middle value of an ordered dataset.
- The mode is the most frequently occurring value.
Now, let's formalize these definitions and see how they are applied in a chemical context.
2. Calculating and Applying Measures of Central Tendency
For a more formal look at these calculations, especially as they appear in scientific literature, we'll turn to a resource written for chemists. The following reading uses a very practical example: analyzing the mass of a set of pennies. This is analogous to many common tasks in an analytical lab, like weighing replicate samples.
Chapter 4 - Evaluating Analytical Data
This excerpt from the textbook 'Analytical Chemistry 2.0' defines and provides formulas for the mean and median, using a dataset of penny masses as an example. It also introduces the important concept of a 'robust' statistic.
Please read the section '4A.1 Measures of Central Tendency'. It begins on page 65 and ends just before '4A.2 Measures of Spread' on page 66. Focus on the formulas for the mean (\bar{X}) and median (\tilde{X}), and the explanation of why the median is considered a more 'robust estimator' than the mean.
This reading highlights a critical point: the mean is heavily influenced by outliers (extreme values), while the median is not. This "robustness" makes the median a very reliable measure when your experimental data might contain unusually high or low values, which can happen due to measurement error, sample contamination, or other unforeseen issues.
The chemistry textbook didn't cover the mode in detail, so let's explore it now. The mode is particularly useful for certain types of data.
Mean, Median, and Mode: Measures of Central Tendency
This article from 'Statistics by Jim' provides a clear explanation of the mode and its applications.
Please read the section titled 'Mode'. Notice its utility for non-numerical (categorical) data, such as classifying crystal defects or identifying the most common synthetic pathway that leads to failure. Also, note the discussion on finding the mode for continuous data.
3. Choosing the Right Measure: It Depends on the Distribution
You now know how to calculate all three measures. The most important skill, however, is knowing which one to use. The choice almost always depends on the distribution of your data—that is, the shape you see when you plot the frequency of your values.
Symmetric vs. Skewed Distributions
- In a symmetric distribution, the data are evenly balanced around the center. A classic example is the "bell curve" or normal distribution, which we will study in depth later.
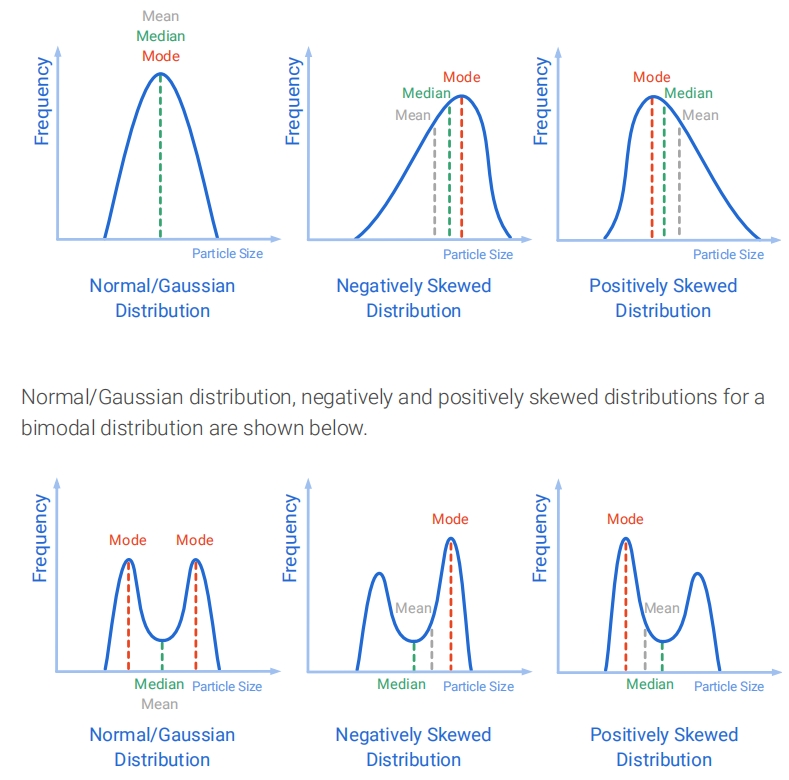
- In a skewed distribution, one tail is longer than the other.
- Positively skewed (or right-skewed): The long tail is on the right side (higher values). This is common in measurements that cannot be negative, like impurity concentrations or particle sizes.
- Negatively skewed (or left-skewed): The long tail is on the left side (lower values). This might occur in data like the percent purity of a product, where most batches are close to 100% but some are significantly lower.
The key insight is that the mean is always pulled in the direction of the long tail in a skewed distribution. The median, being the middle point, is not. The following reading illustrates this beautifully.
Mean, Median, and Mode: Measures of Central Tendency
Let's return to the 'Statistics by Jim' article to see a visual comparison of the mean and median on symmetric versus skewed data.
Please read the section 'Mean vs Median as Measures of Central Tendency'. The histograms showing U.S. household income are a classic example of right-skewed data and clearly demonstrate why the median is a better representation of the 'typical' value in such cases.
The image below provides a perfect summary. It shows the relative positions of the mean, median, and mode for various distribution shapes, using "Particle Size" as a variable—a concept highly relevant to your work in materials chemistry.
Guidelines for Selection
Here is a summary to guide your choice:
-
Use the Mean when:
- Your data is numerical (continuous).
- The distribution is symmetric and doesn't have significant outliers.
- Example: Replicate measurements of a standard solution's concentration from a well-calibrated instrument.
-
Use the Median when:
- Your data is numerical (continuous or ordinal).
- The distribution is skewed or contains outliers.
- Example: Measuring the size of nanoparticles in a sample where a few large agglomerates are present. The mean would be skewed high by the agglomerates, but the median would better represent the size of the primary particles.
-
Use the Mode when:
- You have categorical data.
- You want to find the most frequent value in a discrete or continuous dataset.
- Example: You are synthesizing a material and observe several types of crystal habits (e.g., "needle", "plate", "cubic"). The mode tells you which habit is most common. If your distribution has two distinct peaks (bimodal), such as in the particle size data if there are two distinct populations of particles, reporting both modes is more informative than a single mean or median.
Conclusion
In this lesson, we laid the very first stone in our foundation of statistical analysis. You learned how to calculate and, more importantly, how to select and interpret the three measures of central tendency.
Key Takeaways:
- Mean, median, and mode are all single-value summaries of a dataset, but they describe the "center" in different ways.
- The mean is the average, but it is sensitive to outliers and skewed data.
- The median is the middle value and is robust, making it the preferred choice for skewed distributions.
- The mode is the most frequent value and is the only measure applicable to categorical data.
- Choosing the appropriate measure requires you to first consider the distribution and type of your data. A quick visual plot (like a histogram, which we'll cover soon) is often the best first step.
In our next lesson, we will address the other side of the coin: once we know the center of our data, how do we describe its spread or variability? We will explore measures of dispersion, such as range, variance, and standard deviation, to quantify the precision of your experimental results.