Welcome back! In our last session, we focused on text-based debugging using the Verilog system tasks $display and $monitor. These are excellent for checking specific values or getting a running log of signal changes. However, as designs become more complex, a text log can become difficult to interpret, especially when timing relationships are critical.
This lesson introduces a more powerful and intuitive method: graphical debugging. We will explore how to generate and interpret visual representations of your signals over time. The goal is to master this lesson's learning outcome: Interpret a waveform viewer output to debug a simple design. By the end of this lesson, you'll understand the entire workflow, from telling your simulator what to record to analyzing the resulting waveforms to find bugs.
1. From Text to Graphics: What is a Waveform?
In digital electronics, a timing diagram, or waveform, is a graph that shows how digital signals change over time. The horizontal axis represents time, and the vertical axis represents the state of various signals, which can be either high (1), low (0), or in some cases, high-impedance (Z) or unknown (X).
Waveform viewers are software tools that read simulation data and generate these diagrams, allowing you to visually inspect the behavior of your entire design at a glance.

The short video below gives a quick demonstration of how you read a timing diagram to determine the output of a simple logic gate based on its input waveforms.
This video, "Basic Timing Diagrams" by Mandy Elmore, provides a conceptual walkthrough of reading a timing diagram for a 3-input AND gate.
Watch the entire short video (timing diagram example). Focus on the process: at each point in time where an input changes, you re-evaluate the output. This is exactly what you will do when debugging your own designs.
2. Generating Waveform Data: $dumpvars
A simulator doesn't automatically save waveform data. You must explicitly instruct it to "dump" the values of the signals you want to inspect into a file. This is done using two more system tasks in your testbench.
$dumpfile("filename.vcd");: This tells the simulator the name of the file where the data should be stored. The.vcd(Value Change Dump) extension is a standard format that most waveform viewers can read.$dumpvars(levels, module_or_signals);: This tells the simulator which signals to record.- The first argument,
levels, specifies the depth of module hierarchy to look into. A value of0is common and tells the simulator to dump all signals within the specified module and any modules instantiated within it. - The second argument specifies the top-level module instance you want to record, which is typically your testbench.
- The first argument,
You add these tasks to an initial block in your testbench. They are active for the entire duration of the simulation.
Icarus Verilog + GTKWave Guide
This guide provides a reference for using Icarus Verilog and the GTKWave viewer.
Read the section titled "Creation of .vcd files." It shows you exactly how to add the $dumpfile and $dumpvars tasks to your testbench's initial block.
Let's modify the and_gate_tb.v from our previous lesson to include these tasks.
`timescale 1ns / 1ps

module and_gate_tb;
    // ... signal declarations and DUT instantiation ...

    // ADD THIS BLOCK TO GENERATE WAVEFORM DATA
    initial begin
        $dumpfile("and_gate.vcd"); // Name the output file
        $dumpvars(0, and_gate_tb);  // Dump all signals in this testbench
    end

    // ... clock generation, monitor, and stimulus blocks ...

    initial begin
        // ... stimulus ...
        $finish;
    end
endmodule
With these additions, running a simulation will now produce a file named and_gate.vcd in your working directory.
3. The Debugging Workflow: Compile, Simulate, View
Now we'll walk through the complete, practical process of simulating a design and viewing the waveform. The workflow consists of three command-line steps:
- Compile (
iverilog): Compile your Verilog source files (.v) into an executable simulation file. - Simulate (
vvp): Run the compiled file. This step executes your testbench and, thanks to the$dumpvarstask, creates the.vcdwaveform file. - View (
gtkwave): Open the.vcdfile in a waveform viewer to analyze the results.
The following video demonstrates this entire process using a half-adder example. It's a perfect walkthrough of the hands-on skills for this lesson.
Introduction to Verilog HDL using Free Software Icarus, GTKWave, and VS Code
This video demonstrates the full cycle of compiling, simulating, and viewing waveforms using Icarus Verilog and GTKWave.
Watch the section from compiling to viewing. Pay close attention to the three distinct command-line steps and how the presenter interacts with the GTKWave interface to select and view the signals.
4. Interpreting Waveforms in GTKWave
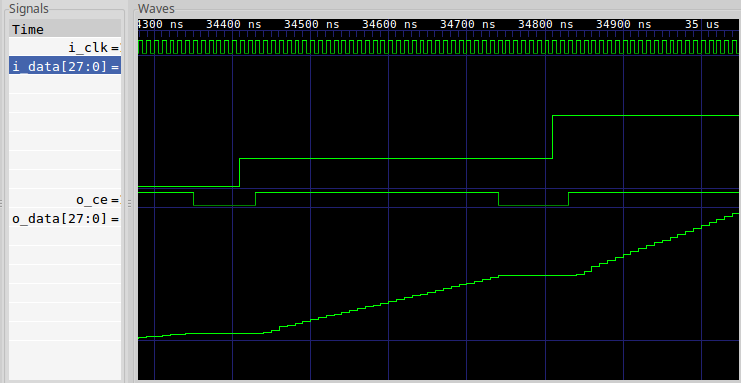
As you saw in the video, once you open the .vcd file in GTKWave, you are presented with a few key windows:
- SST (Signal Structure Tree): On the left, this shows the hierarchy of your design. You can expand your testbench module (
and_gate_tbin our example) to see all the signals (clk,dut_a,dut_b,dut_y) inside it. - Signals: Below the SST, this pane lists the signals you have chosen to view.
- Wave Window: The main area on the right where the waveforms for the selected signals are displayed.
To debug, you follow these steps:
- In the SST pane, expand your testbench module.
- Select the signals you want to inspect (e.g.,
dut_a,dut_b,dut_y) and click the "Insert" button or drag them into the "Signals" pane. - Analyze the Wave Window. Click on the waveform at different points in time. The value of each signal at that specific time will be displayed next to its name in the "Signals" pane.
- Compare the observed behavior with the expected behavior. For our AND gate, find the time around 30ns. Is
dut_ahigh? Isdut_bhigh? If so, isdut_yalso high? If not, you've found a bug!
5. Pro-Tips for Efficient Debugging
Constantly re-adding signals every time you open GTKWave is tedious. Here are two tips to make your debugging sessions more efficient.
Icarus Verilog + GTKWave Guide
This section of the guide covers useful features for a better viewing experience.
Read the sections titled "NOTE: When I close and re-open GTKWave..." and "A better view on things." These cover how to save your signal configuration and change how data is displayed.
-
Save Your Configuration: After arranging the signals you want to view, go to File -> Write Save File As... and save your layout as a
.gtkwfile (e.g.,and_gate.gtkw). The next time you launch the viewer, you can open both files at once:gtkwave and_gate.vcd and_gate.gtkw
This will load your simulation data and your preferred signal view automatically. -
Change Data Format: By default, multi-bit signals are shown in hex. This is not always ideal. You can right-click on any signal in the "Signals" pane, go to Data Format, and change its representation to Binary, Decimal, ASCII, etc. This is invaluable when debugging counters, state machines, or data processors.
Conclusion
You have now added a powerful visual debugging tool to your skillset. While $monitor is great for a quick check, a waveform viewer is the standard tool for understanding the complex timing and relationships between signals in a digital design.
Key Takeaways:
- Waveforms provide an intuitive, graphical representation of signal activity over simulation time.
- The
$dumpfileand$dumpvarssystem tasks are used in a testbench to generate a.vcdfile containing the simulation data. - The standard workflow is: Compile (
iverilog), Run (vvp), and View (gtkwave). - Debugging involves adding relevant signals to the wave viewer and comparing their behavior against the design's expected functionality.
- Using features like save files (
.gtkw) and changing data formats will significantly speed up your debugging process.
In the next module, we will dive deep into modeling combinational logic. You will be using the testbench and waveform viewing skills you've acquired in this module to verify every circuit you build. We'll start by learning how to implement basic logic gates using continuous assign statements.