Welcome back. In our last lesson, we mastered CPU profiling, learning how to pinpoint performance hot spots in our broker's code. We now have a clear picture of where our application spends its time.
Today, we shift our focus from execution speed to resource stability. This lesson addresses the learning outcome: Use pprof to capture and analyze a heap profile to identify memory allocation patterns and potential goroutine leaks.
We will investigate two critical aspects of memory performance:
- Heap Allocations: How our program uses memory. We'll learn to identify which parts of our code allocate the most memory, which can lead to high garbage collection (GC) pressure, and how to spot memory leaks where memory is allocated but never released.
- Goroutine Leaks: A silent but deadly issue where goroutines are created but get stuck and never terminate, slowly consuming system resources until the application fails.
Understanding memory is just as crucial as understanding CPU. An application that is fast but unstable due to memory issues is not production-ready.
1. Analyzing the Heap: Where Does the Memory Go?
The heap is the region of memory where Go's runtime manages dynamically allocated objects—the structs, slices, and other data structures you create that live beyond a single function call. A heap profile is a snapshot of this activity.
What a Heap Profile Measures
Unlike a CPU profile that measures time, a heap profile measures memory. It does this through sampling. By default, pprof records information for every 512 kilobytes of memory allocated. This keeps the profiling overhead low enough to be used safely in production.
pprof provides four different ways to view this data, which you can switch between in the UI:
inuse_space: Memory that is currently allocated and has not been garbage collected. This is your primary tool for finding memory leaks.inuse_objects: The number of objects corresponding toinuse_space.alloc_space: The total memory allocated since the program started, including memory that has since been freed. This is your primary tool for identifying sources of GC pressure and code inefficiencies.alloc_objects: The total number of objects corresponding toalloc_space.
How I investigated memory leaks in Go using pprof on a large codebase
The article 'How I investigated memory leaks in Go using pprof' provides an excellent overview of the different pprof profiles and the distinction between the 'inuse' and 'alloc' modes. This will clarify the concepts we just introduced.
Please read the sections 'pprof profiles' and 'Using pprof'. Focus on the descriptions of the 'heap' and 'allocs' profiles, and the explanation of the four sample types (inuse_space, inuse_objects, etc.).
Capturing and Analyzing a Live Heap Profile
The process is very similar to what we did for CPU profiling. We'll generate some load and inspect the heap profile to see our memory allocation patterns in action.
Step 1: Start the Broker
In a terminal, run the broker as before:
go run ./cmd/broker
Make sure the observability server is running on port 6060.
Step 2: Capture the Heap Profile
In a second terminal, use go tool pprof to connect to the /debug/pprof/heap endpoint. We will use a different port for the UI to avoid conflicts with our previous session.
go tool pprof -http=:8082 http://localhost:6060/debug/pprof/heap
This command will immediately fetch the current heap profile and open the pprof web UI in your browser at http://localhost:8082.
Step 3: Analyze the Profile
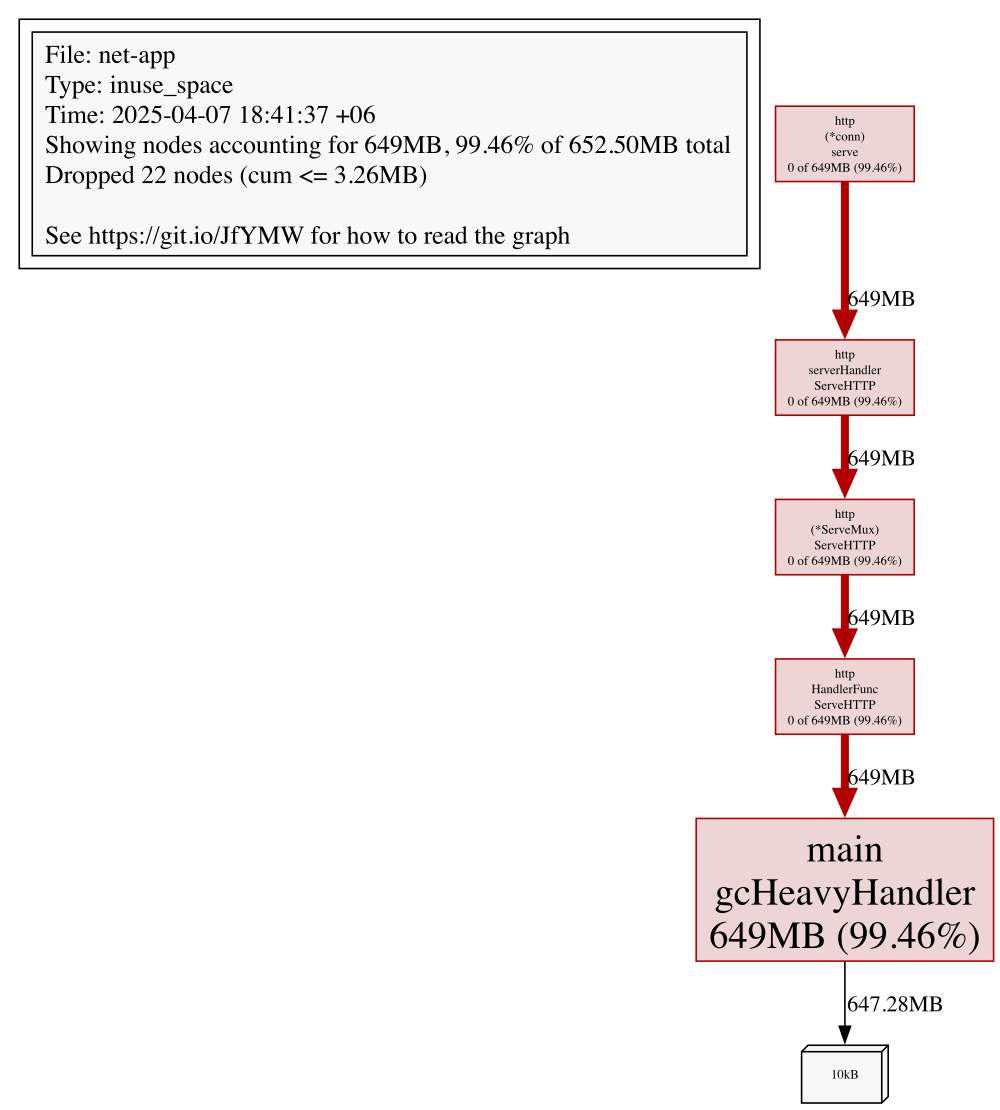
You are now looking at the inuse_space profile by default.
- Switch to
alloc_space: In the UI, use the "Sample" dropdown menu to switch to thealloc_spaceview. This shows you the total memory allocated by your broker. - Use the Graph View: Look at the graph. You should see a significant portion of allocations originating from our
handleProduceRequestfunction. Follow the call path. The code that creates newMessageobjects and serializes them is likely a top allocator. This is expected behavior. Highalloc_spaceisn't necessarily a bug, but it points to code that could be optimized to reduce GC pressure if it becomes a bottleneck.
The Hunt for a Memory Leak
A true memory leak is when inuse_space grows over time without bound. The most effective way to detect this is by comparing two heap profiles taken some time apart.
Let's simulate this workflow:
-
Capture a Baseline: In a terminal (while the broker is running but idle), save a baseline heap profile.
curl -o heap1.prof http://localhost:6060/debug/pprof/heap -
Generate Load: Now, run our producer benchmark for 30 seconds to create and process many messages.
go test ./... -bench=BenchmarkProducerThroughput -benchtime=30s -v -
Capture a Second Profile: Immediately after the benchmark completes, capture another heap profile.
curl -o heap2.prof http://localhost:6060/debug/pprof/heap -
Compare the Profiles: Now, use
pprofto load the second profile and compare it against the first as a baseline.go tool pprof -http=:8083 -base heap1.prof heap2.prof
This command starts a new pprof UI session on port 8083. The view you see now is the difference between the two snapshots. It shows you the memory that was allocated between the two snapshots and is still in use. For a healthy application without leaks, this value should be small. For an application with a leak, this view will point directly to the functions that are allocating the memory that is not being freed.
Finding Memory Leaks in Go Programs - Oleg Shaldybin
This video provides a clear, practical demonstration of this exact workflow: taking two snapshots and comparing them to identify accumulating objects.
Watch from 08:38 to 09:23 to see how to capture and compare snapshots. Then, watch the case study from 12:48 to 16:08. Notice how the presenter uses the comparison view to find that NATS subscriptions are not being released, and then verifies the fix by seeing that the comparison profile becomes empty.
In our broker, because we write data to disk and don't hold it in memory, the comparison profile should be relatively flat. If we had a bug, like appending every message to a global slice, this view would light up, showing that slice growing uncontrollably.
2. Finding Goroutine Leaks
A goroutine leak occurs when a goroutine starts but blocks forever, never terminating. This can happen if it's waiting to send or receive on a channel that no other part of the program is interacting with. These are particularly insidious because they don't cause an immediate crash; they slowly drain resources until the system becomes unstable.
Detecting goroutine leaks with synctest/pprof
This article from Anton Zhiyanov provides the best overview available on detecting goroutine leaks, covering both traditional methods and a powerful new experimental feature in Go.
Please read the introduction and the 'A simple leak' section. This will give you a concrete definition of a goroutine leak and a classic example of how one can occur with an unbuffered channel.
Spotting a Leak in Action
Let's intentionally create a goroutine leak in our broker to see how we can detect it.
Step 1: Introduce a Leaky Handler
Open cmd/broker/main.go. In the main function, where you set up the observability server, add a new handler that creates a leaky goroutine.
// Inside main(), right after setting up the pprof handlers...
observabilityMux := http.NewServeMux()
observabilityMux.HandleFunc("/debug/pprof/", pprof.Index)
observabilityMux.HandleFunc("/debug/pprof/cmdline", pprof.Cmdline)
observabilityMux.HandleFunc("/debug/pprof/profile", pprof.Profile)
observabilityMux.HandleFunc("/debug/pprof/symbol", pprof.Symbol)
observabilityMux.HandleFunc("/debug/pprof/trace", pprof.Trace)

// ADD THIS NEW HANDLER
observabilityMux.HandleFunc("/debug/leak", func(w http.ResponseWriter, r *http.Request) {
    go func() {
        // This goroutine will block forever because nothing ever
        // receives from this unbuffered channel.
        ch := make(chan int)
        ch <- 1
    }()
    w.Write([]byte("Leaky goroutine created!"))
})

// ... rest of the setup for the observability server
Step 2: Observe the Leak
Restart your broker with the new code. We will now check the goroutine count, trigger the leak, and check it again.
-
Check initial count: In a terminal, view the goroutine profile. It's a text file, not a graph. The first line tells you the total count.
curl http://localhost:6060/debug/pprof/goroutineNote the number of goroutines (e.g.,
goroutine profile: total 8). -
Trigger the leak: Run this command a few times to create several leaked goroutines.
curl http://localhost:6060/debug/leak curl http://localhost:6060/debug/leak curl http://localhost:6060/debug/leak -
Check the final count: Check the goroutine profile again.
curl http://localhost:6060/debug/pprof/goroutineYou will see that the total number of goroutines has increased by 3. If you inspect the full output, you will find 3 new goroutines stuck in the state
[chan send], with a stack trace pointing to our leaky handler. This is the classic manual method of detecting a leak.
Modern Goroutine Leak Detection (Go 1.26+)
Manually comparing counts is tedious. The Go team has introduced an experimental profile that automatically detects leaked goroutines.
Detecting goroutine leaks with synctest/pprof
The same article we read before explains this new feature. It's a significant improvement for diagnosing these issues.
Read the sections 'Detecting the leak: pprof' and 'Leak detection algorithm'. This will show you how to use the new goroutineleak profile and provide a high-level understanding of how it magically identifies which goroutines are permanently stuck.
To use this, you must enable the experiment via an environment variable and request a specific debug level from the pprof endpoint.
Step 1: Run with the Experiment Flag
Stop your broker and restart it with the GOEXPERIMENT flag.
GOEXPERIMENT=goroutineleakprofile go run ./cmd/broker
Step 2: Trigger the Leak and Profile
First, hit the leak endpoint a few times as before:
curl http://localhost:6060/debug/leak
curl http://localhost:6060/debug/leak
Now, fetch the special leak-detecting profile using debug=2.
curl http://localhost:6060/debug/pprof/goroutine?debug=2
In the output, you will see the goroutines from our handler explicitly marked as (leaked). This powerful feature provides definitive proof of a leak and its origin without any manual comparison.
Conclusion
In this lesson, we expanded our profiling toolkit to cover the crucial domain of memory. You now have the skills to diagnose two of the most common and critical issues in long-running Go services.
Key Takeaways:
- Heap Profiling:
alloc_spaceshows total allocations and is useful for finding code that creates GC pressure.inuse_spaceshows live, un-freed memory and is the key to finding memory leaks.- The most powerful technique for finding leaks is to compare two
inuse_spaceprofiles taken over time to see what memory is accumulating.
- Goroutine Profiling:
- A goroutine leak occurs when a goroutine blocks indefinitely, typically on a channel or mutex.
- You can detect leaks by observing an ever-increasing count in the
/debug/pprof/goroutineprofile. - The experimental
goroutineleakprofile (Go 1.26+) automates this detection, explicitly marking leaked goroutines in its output.
Next Up
We have profiled our application for both CPU and memory bottlenecks. The final piece of the reliability puzzle is ensuring correctness under concurrency. In our next lesson, we will tackle another common bug in concurrent systems: data races. You will learn to use Go's built-in race detector to detect and fix data races in concurrent code by running tests with the -race flag.