Hello and welcome back.
In our previous lessons, we built a powerful benchmarking suite to measure our broker's throughput and, critically, its end-to-end latency distribution. We now have the tools to answer the question, "How fast is it?". This is a fantastic start, but it naturally leads to the next question: "Why isn't it faster?"
Today, we'll start answering that "why". This lesson directly addresses the learning outcome: Instrument the broker with pprof endpoints for live CPU and memory profiling. We will integrate Go's standard profiling tool, pprof, into our broker. This will give us a "live view" inside our running application, turning it from a black box into a system we can observe and diagnose.
1. Understanding Go's Profiling Toolkit
pprof is the name for Go's built-in profiling ecosystem. It consists of two main components:
- A package in the standard library (
runtime/pprofandnet/http/pprof) that collects profiling data from a running Go program. - A command-line tool (
go tool pprof) that retrieves, analyzes, and visualizes this data.
pprof can generate several different kinds of profiles, each offering a unique perspective on your application's behavior. For your goal of achieving mastery, it's worth understanding the most important ones.
GopherCon 2021: Go Profiling and Observability from Scratch - Felix Geisendörfer
The GopherCon talk "Go Profiling and Observability from Scratch" by Felix Geisendörfer provides an excellent, in-depth explanation of how Go's profilers work under the hood. Watching these specific clips will give you a solid foundation for interpreting the data we're about to collect.
Please watch the following segments: CPU Profiler (9:19 - 12:54): Understand how it uses signal-based sampling to see where CPU time is spent. Memory Profiler (18:37 - 20:33): Learn how it samples heap allocations to track memory usage. Goroutine Profiler (20:33 - 22:04): See how this profile provides a snapshot of all running goroutines, which is invaluable for detecting leaks.
As you saw, these are not just simple counters. They are sophisticated sampling tools that provide deep insights with surprisingly low overhead, making them suitable even for production environments.
2. Instrumenting the Broker
Our first practical step is to expose the pprof data via HTTP endpoints. While our broker communicates over TCP for its primary function, adding an HTTP server for observability is a standard and highly effective pattern in system design.
We will start a separate HTTP server in a goroutine. This cleanly separates the application's core logic from its administrative/observability functions and ensures the profiling endpoints don't interfere with the main TCP server.
The simplest way to enable the pprof handlers is by importing the net/http/pprof package with a blank identifier (_). This import has the "side effect" of registering the pprof handlers with the default HTTP ServeMux.
Let's modify our broker's Start method to launch this observability server.
-
Create a helper function: In your
broker.gofile (or a newobservability.gofile within the same package), create a function to start the server.// In internal/broker/broker.go (or similar) import ( "log" "net/http" _ "net/http/pprof" // Import for side-effect: registers pprof handlers ) // startObservabilityServer runs an HTTP server for pprof and other diagnostics. // It's good practice to run this on a separate port not exposed to the public. func (b *Broker) startObservabilityServer() { log.Println("Starting observability server on :6060") // This server should only be accessible from internal networks or via port-forwarding. err := http.ListenAndServe("localhost:6060", nil) if err != nil { log.Printf("failed to start observability server: %v", err) } } -
Launch it from
Start: Now, call this function as a goroutine from your mainStartmethod.// In internal/broker/broker.go // ... other imports func (b *Broker) Start(ctx context.Context) error { // ... (existing code for setting up TCP listener) // Add this line: go b.startObservabilityServer() // ... (existing code for the accept loop and shutdown) return nil }
That's it! With these changes, when you run your broker, it will now be listening on port 6060 for profiling requests in addition to its main TCP port.
3. Accessing Live Profiling Data
Now that the endpoints are active, let's explore them. Make sure your broker is running (you can run it from your IDE or terminal).
The pprof Index
First, open your web browser and navigate to http://localhost:6060/debug/pprof/.
You'll see a page listing all available profiles. This index page is a convenient starting point. You can click on goroutine to get a full stack dump of all current goroutines, which is a powerful way to debug deadlocks or leaks.
Let's watch a quick, practical demonstration of using this goroutine profile page to find a very common bug: a resource leak.
Watch from 00:10 to 04:38. The video shows a web service that leaks goroutines because it doesn't close an HTTP response body. Pay attention to how the number of goroutines increases after some traffic and how the pprof page reveals exactly where they are stuck.
While the web UI is useful for a quick look, the real power comes from the go tool pprof command.
Capturing a CPU Profile
The CPU profile shows where your program is spending its time executing code. It is the most common tool for diagnosing performance bottlenecks.
-
Run a load: To get a meaningful profile, the application needs to be doing work. You can run the
BenchmarkEndToEndLatencytest we wrote in the last lesson, but change it from a benchmark to a regular test that runs for a fixed duration (e.g., 30-60 seconds) to generate load. -
Capture the profile: While the load is running, open a terminal and execute the following command. It will collect data for 30 seconds and then open an interactive visualization tool in your browser.
go tool pprof -http=:8081 http://localhost:6060/debug/pprof/profile?seconds=30-http=:8081tellspprofto launch its web UI on port8081.- The URL points to the live CPU profile endpoint.
?seconds=30specifies the collection duration.
You should see a new browser tab open with a visual representation of your CPU usage.
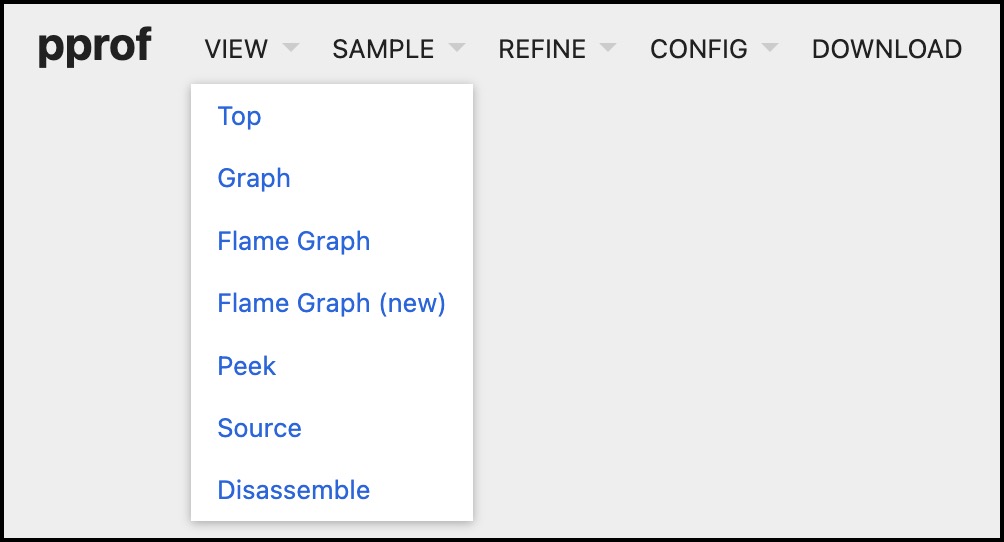
The two most useful views are:
- Graph: A call graph showing functions as boxes. The bigger the box, the more CPU time that function (and its children) consumed. Arrows show the call relationships.
- Flame Graph: This view excels at showing call stacks. The width of each block represents the amount of CPU time consumed. Looking for wide blocks at the top of the graph is a great way to spot hot spots.
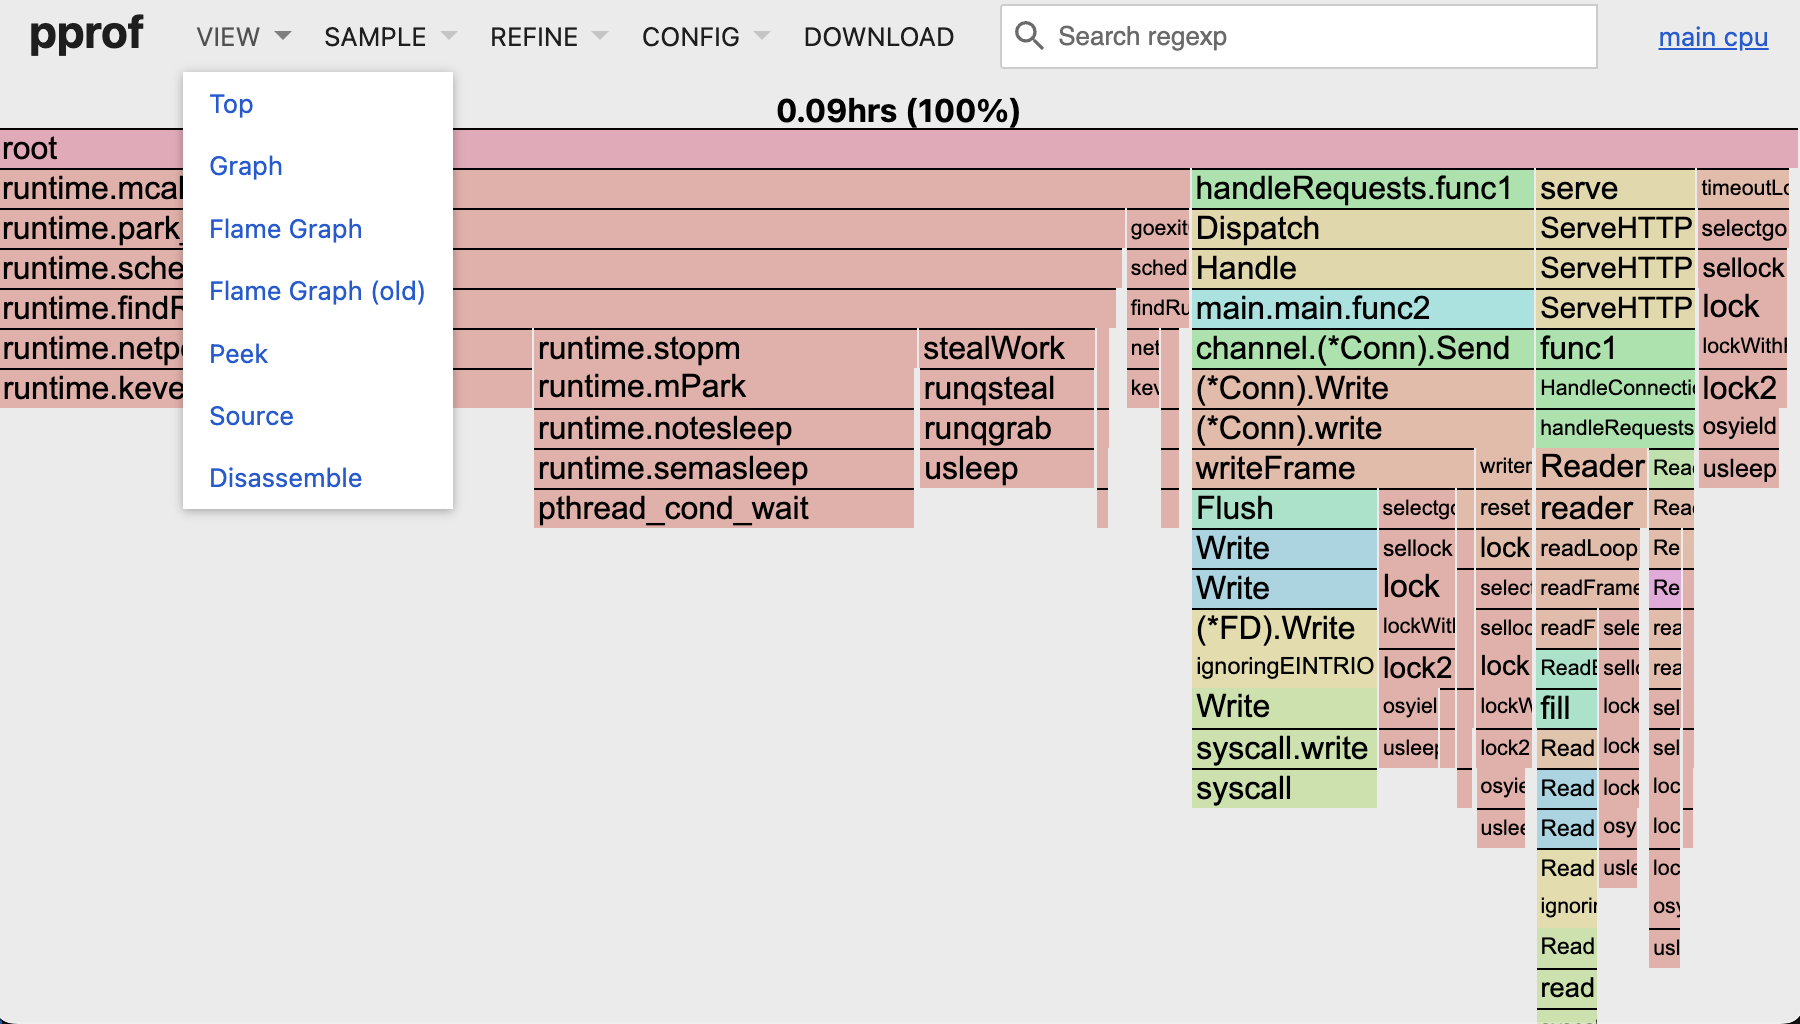
Capturing a Memory (Heap) Profile
The heap profile shows where your memory is being allocated. This is essential for finding memory leaks and identifying code that creates excessive garbage for the GC to clean up, which in turn can cause CPU overhead and latency spikes.
You can capture and view the current in-use memory with a similar command:
go tool pprof -http=:8082 http://localhost:6060/debug/pprof/heap
The web UI is the same, but the data it displays is different. pprof for heap profiles has four main sample types you can select from the "SAMPLE" dropdown:
inuse_space: Shows memory that is currently allocated and not yet freed. Excellent for finding memory leaks.inuse_objects: Shows the number of objects currently allocated.alloc_space: Shows all memory that has been allocated since the program started (including what's been freed). Excellent for finding code that causes high GC pressure.alloc_objects: Shows the total number of objects allocated since the program started.
This article, "A Pattern for Optimizing Go," provides a concise walkthrough of collecting and analyzing both CPU and heap profiles.
Please read from the beginning through "Step 3: Investigate the Causes of GC." Focus on the commands used to collect CPU (/profile) and heap (/heap) profiles and the brief analysis of what the results mean. This reinforces the commands we just discussed.
Conclusion
In this lesson, we successfully instrumented our broker for live performance analysis. This is a massive step forward in building a production-grade system. You are no longer just measuring performance from the outside; you can now look inside to understand its behavior.
Key Takeaways:
pprofis Go's standard tool for profiling CPU, memory, and concurrency.- It's a common and robust pattern to run an observability HTTP server on a separate, non-public port.
- The
net/http/pprofpackage provides handlers that can be easily added to anyhttp.ServeMux. - CPU profiles (
/debug/pprof/profile) show where time is spent and are captured over a duration. - Heap profiles (
/debug/pprof/heap) show where memory is allocated and are instantaneous snapshots. - The
go tool pprof -httpcommand is the primary way to collect and visualize profiling data.
Next Up
We have laid all the groundwork. We have the broker, the benchmarks to create load, and the pprof endpoints to observe it. In our next lesson, we will put it all together. We will use pprof to capture a real CPU profile from our broker under load, analyze the results to find a performance hot spot, and begin the process of optimization.