Hello! Welcome back to our advanced Go project course.
In our last lesson, we built a concurrent benchmarking suite to measure the producer throughput of our message broker. This gave us a crucial metric: operations per second (ops/sec). We now have a baseline for how many messages our system can ingest.
However, throughput is only half of the performance story. A system might process a million messages a second, but if each message takes a full second to travel through the system, it will feel incredibly slow to the end-user. This brings us to our focus for today: latency.
This lesson directly addresses the learning outcome: Extend the benchmark suite to measure end-to-end message latency from produce to consume. We will move beyond just measuring the Produce call and instead measure the full round-trip time for a message, giving us a complete picture of our broker's responsiveness.
1. Throughput vs. Latency: Beyond Averages
Throughput tells us how many operations happen in a given time. Latency tells us how long a single operation takes. For our broker, end-to-end latency is the time elapsed from the moment a producer sends a message to the moment a consumer receives it.
A common mistake is to rely on average latency. Averages can be dangerously misleading because they hide outliers. Imagine ten requests: nine take 10ms each, but one takes 500ms due to a network hiccup or garbage collection pause.
- Average latency: (9 * 10ms + 1 * 500ms) / 10 = 59ms
- Reality: 90% of your users experienced a 10ms latency, but 10% had a terrible 500ms experience. The average of 59ms represents neither group accurately.
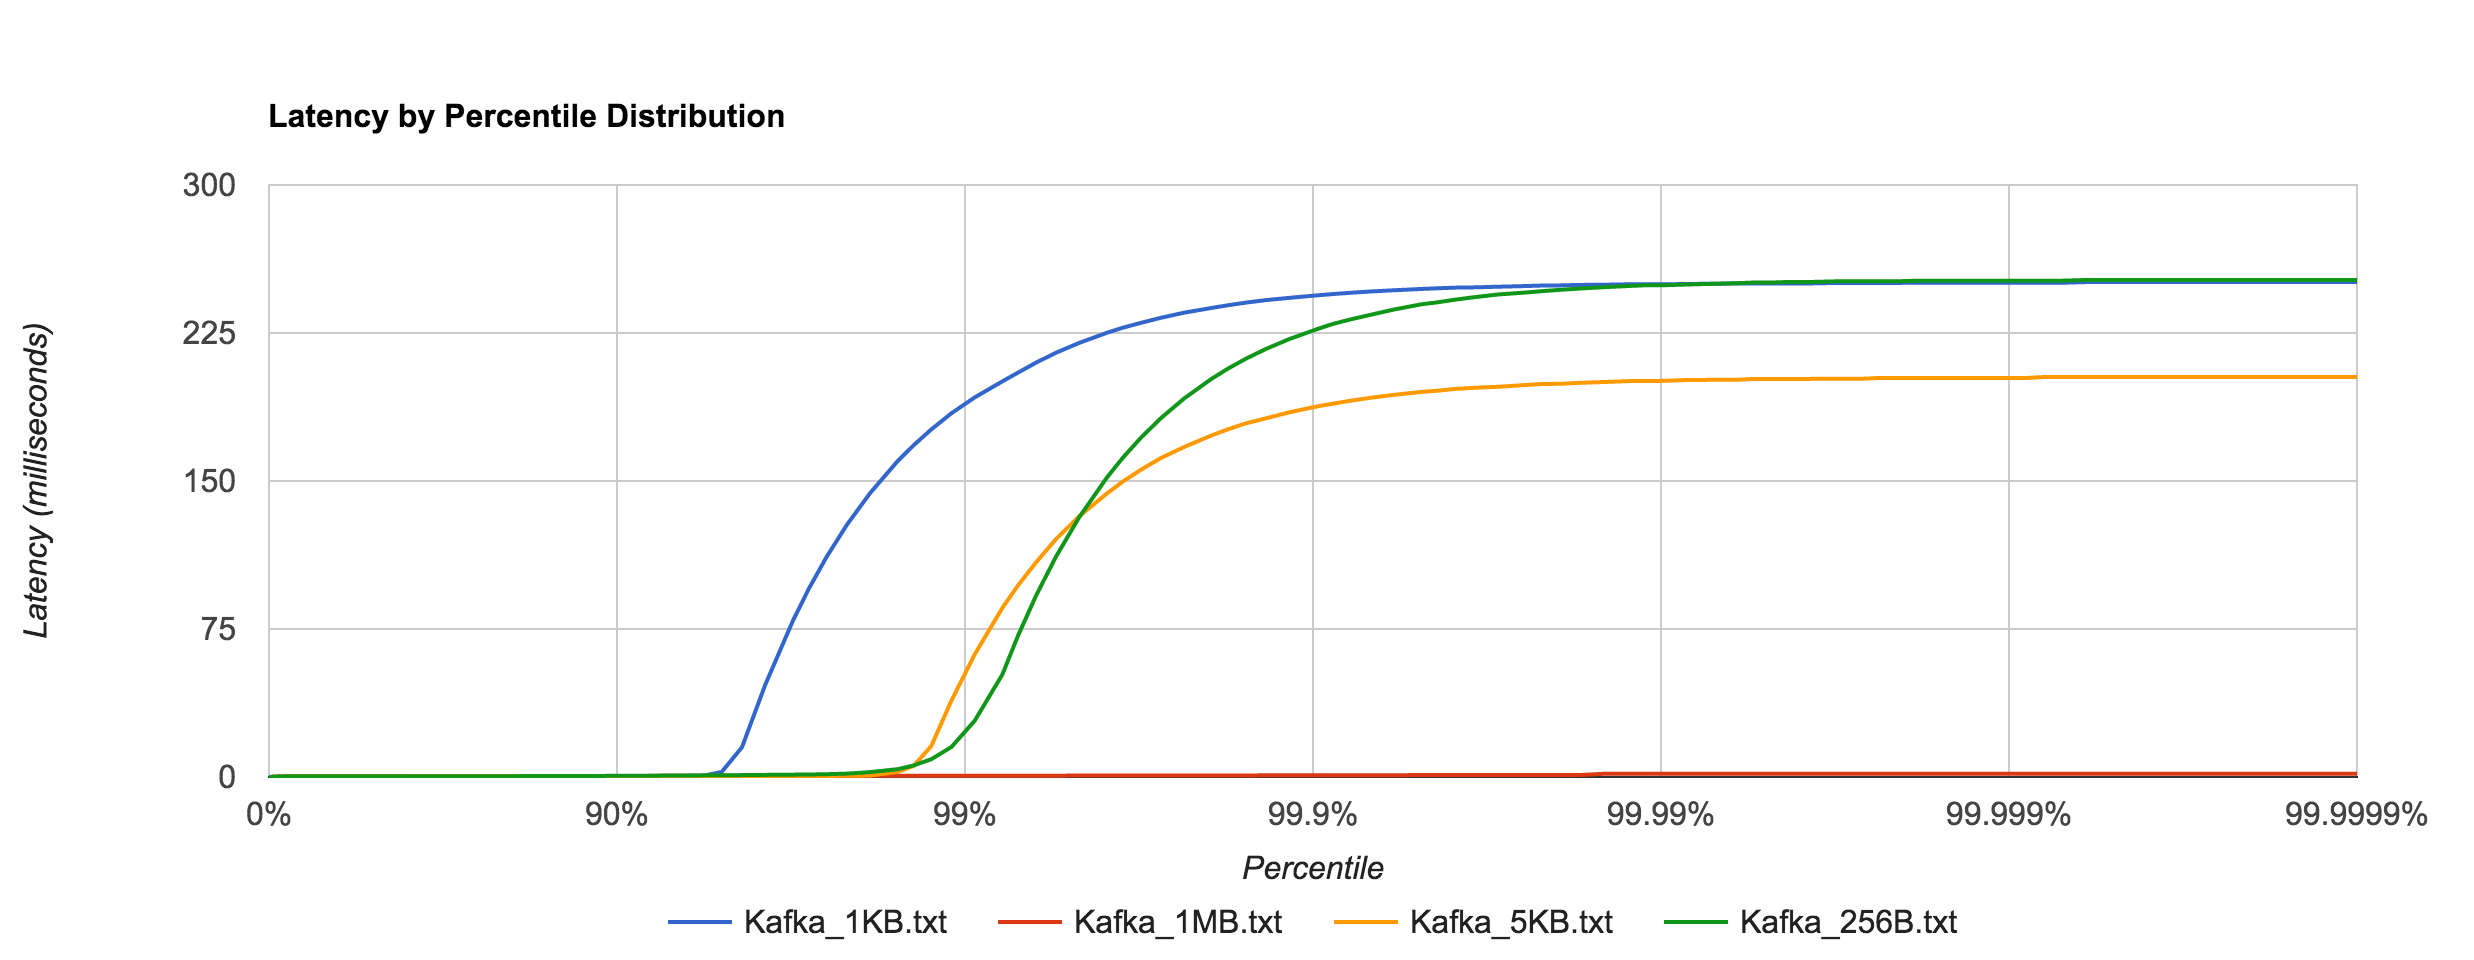
To get a true picture, we must look at the latency distribution using percentiles.
- p50 (Median): The value at which 50% of requests are faster.
- p90, p99, p99.9: The values at which 90%, 99%, and 99.9% of requests are faster, respectively.
- Max: The latency of the single slowest request.
These "tail latencies" (p99 and above) are critical because they represent the worst-case user experience. The graph below illustrates this concept perfectly.
2. A Tool for Measuring Latency Distribution
To capture a detailed latency distribution, we need a helper utility. The simple ns/op from the standard testing.B output isn't enough. We'll create a LatencyRecorder that collects individual measurements and then calculates the percentile distribution for us.
No Garbage Collection in Go: Performance Benchmarks
The article "No Garbage Collection in Go: Performance Benchmarks" contains an excellent, self-contained utility for recording and analyzing latency distributions. We will borrow and adapt this code for our project.
Please read the first part of the article, focusing on the Go code provided in "Step 1: Setting Up the Benchmark Environment." We are interested in the LatencyRecorder struct and its associated PrintStats function. Understand how it collects durations and then calculates the mean, median, various percentiles, and max latency.
Let's create a new file in your project, perhaps pkg/metrics/recorder.go, and place this utility code there. Here's a version adapted for our concurrent benchmark, with a mutex to ensure thread-safe recording:
// In pkg/metrics/recorder.go

package metrics

import (
	"fmt"
	"math"
	"sort"
	"sync"
	"time"
)

// LatencyRecorder tracks operation latencies in a thread-safe manner.
type LatencyRecorder struct {
	mu        sync.Mutex
	Latencies []time.Duration
	StartTime time.Time
}

// NewLatencyRecorder creates a new latency recorder.
func NewLatencyRecorder() *LatencyRecorder {
	return &LatencyRecorder{
		Latencies: make([]time.Duration, 0, 100_000),
		StartTime: time.Now(),
	}
}

// Record adds a latency measurement.
func (lr *LatencyRecorder) Record(latency time.Duration) {
	lr.mu.Lock()
	defer lr.mu.Unlock()
	lr.Latencies = append(lr.Latencies, latency)
}

// PrintStats outputs latency statistics.
func (lr *LatencyRecorder) PrintStats(label string) {
	lr.mu.Lock()
	defer lr.mu.Unlock()

	if len(lr.Latencies) == 0 {
		fmt.Printf("%s: No latencies recorded\n", label)
		return
	}

	// Sort a copy to not hold the lock during sorting
	sorted := make([]time.Duration, len(lr.Latencies))
	copy(sorted, lr.Latencies)
	sort.Slice(sorted, func(i, j int) bool { return sorted[i] < sorted[j] })

	total := len(sorted)
	var sum time.Duration
	for _, lat := range sorted {
		sum += lat
	}

	mean := sum / time.Duration(total)
	p50 := percentile(sorted, 0.50)
	p90 := percentile(sorted, 0.90)
	p99 := percentile(sorted, 0.99)
	p999 := percentile(sorted, 0.999)
	maxLat := sorted[total-1]

	fmt.Printf("\n--- Latency Stats: %s ---\n", label)
	fmt.Printf("Operations:  %d\n", total)
	fmt.Printf("Mean:        %v\n", mean)
	fmt.Printf("p50 (Median): %v\n", p50)
	fmt.Printf("p90:         %v\n", p90)
	fmt.Printf("p99:         %v\n", p99)
	fmt.Printf("p99.9:       %v\n", p999)
	fmt.Printf("Max:         %v\n", maxLat)
	fmt.Printf("---------------------------\n")
}

// percentile calculates the q-percentile from a sorted slice.
func percentile(sorted []time.Duration, q float64) time.Duration {
	if len(sorted) == 0 {
		return 0
	}
	if q <= 0 {
		return sorted[0]
	}
	if q >= 1 {
		return sorted[len(sorted)-1]
	}
	pos := q * float64(len(sorted)-1)
	lo := int(math.Floor(pos))
	hi := int(math.Ceil(pos))
	if lo == hi {
		return sorted[lo]
	}
	frac := pos - float64(lo)
	return sorted[lo] + time.Duration(frac*float64(sorted[hi]-sorted[lo]))
}
3. Implementing the End-to-End Latency Benchmark
Unlike our previous throughput test, which was a "fire-and-forget" operation, a latency test requires a full round trip. Each operation must consist of:
- A producer sending a message.
- A consumer receiving that message.
- A signal to confirm the round trip is complete.
We will extend the broker_benchmark_test.go file from the previous lesson. We'll use b.RunParallel to simulate concurrent users, where each user is a producer/consumer pair. Each pair will use a channel to coordinate its own round trips.
Here is the implementation for BenchmarkEndToEndLatency.
// In broker_benchmark_test.go

// (setupTestBroker helper function from previous lesson should be here)
// import your metrics package: "your-project-path/pkg/metrics"

func BenchmarkEndToEndLatency(b *testing.B) {
	// --- Global Setup ---
	ctx, cancel := context.WithCancel(context.Background())
	defer cancel()

	broker := setupTestBroker(b)
	go func() {
		_ = broker.Start(ctx)
	}()

	time.Sleep(100 * time.Millisecond) // Wait for broker to be ready

	topic := "benchmark-latency-topic"
	_ = broker.createTopic(ctx, topic)

	payload := []byte("a message for latency testing")

	// Instantiate our latency recorder
	recorder := metrics.NewLatencyRecorder()

	b.ResetTimer()

	// --- Run in Parallel ---
	b.RunParallel(func(pb *testing.PB) {
		// --- Goroutine-Local Setup ---
		producer, err := client.New(broker.Addr())
		if err != nil {
			b.Errorf("failed to create producer client: %v", err)
			return
		}
		defer producer.Close()

		consumer, err := client.New(broker.Addr())
		if err != nil {
			b.Errorf("failed to create consumer client: %v", err)
			return
		}
		defer consumer.Close()

		// Channel for this goroutine's consumer to signal message receipt
		done := make(chan struct{})

		// Start the consumer loop for this goroutine
		go func() {
			err := consumer.Consume(ctx, topic, "latency-group", func(msg client.Message) {
				// Signal that the message was received
				done <- struct{}{}
			})
			if err != nil && err != context.Canceled {
				// In a real test you might handle this more gracefully
				fmt.Printf("consumer error: %v\n", err)
			}
		}()

		// --- The Measured Operation ---
		for pb.Next() {
			start := time.Now()

			// 1. Produce message
			if err := producer.Produce(ctx, topic, payload); err != nil {
				b.Errorf("produce failed: %v", err)
				continue // Don't measure failed attempts
			}

			// 2. Wait for consumer to receive it
			<-done

			// 3. Record the latency
			recorder.Record(time.Since(start))
		}
	})

	// --- Print Final Stats ---
	// This happens after all parallel runs are complete
	b.StopTimer()
	recorder.PrintStats("End-to-End Latency")
}
Run this new benchmark from your terminal:go test -bench=EndToEndLatency -run=^$
The -run=^$ flag ensures that no unit tests are run, only the specified benchmark. Because we are printing custom output, the standard ns/op line is less important. You will see the detailed percentile report from our PrintStats function.
4. A Word of Caution: Coordinated Omission
Our benchmark is what's known as a "closed-loop" test: it sends one request and waits for the full response before sending the next. This is a very common and useful pattern.
However, it's important to be aware of a subtle measurement pitfall known as Coordinated Omission. In a real-world system with a constant stream of incoming requests (an "open loop"), if the broker stalls for a moment, requests will pile up. The time a request spends waiting in a queue before being processed is part of the true latency experienced by the user.
A closed-loop benchmark "coordinates" with the system under test by naturally backing off when the system is slow—it won't send the next request until the slow one is finished. This can artificially lower the measured latency, especially at the high percentiles.
Benchmarking Message Queue Latency
This classic article on benchmarking message queues explains the critical flaw in many naive latency benchmarks. Understanding this will make you a much more critical consumer and creator of performance tests.
Read the sections "Tooling and Methodology" and "Conclusion." Focus on the explanation of 'service time' vs. 'response time' and the cashier analogy for coordinated omission. The key takeaway is to always 'look at the complete latency distribution' and be critical of benchmark results.
While fully correcting for coordinated omission requires sophisticated tooling (like HDR Histogram), being aware of it is a huge step. For our purposes, our concurrent closed-loop benchmark provides an excellent and practical measure of latency under load, far superior to a simple average.
Conclusion
Excellent work! You have now extended your performance testing suite to capture not just throughput, but also a detailed breakdown of end-to-end message latency. You have the tools to analyze both the capacity and responsiveness of your broker.
Key Takeaways:
- End-to-end latency is a critical performance metric that complements throughput.
- Average latency is misleading; analyzing the full percentile distribution (p50, p99, p99.9, max) is essential for understanding system behavior and user experience.
- Measuring round-trip latency in a benchmark requires coordinating a producer and consumer, often using a channel.
- A
LatencyRecorderutility is a practical way to collect measurements and generate detailed percentile reports. - Advanced benchmarking has subtleties like Coordinated Omission, and it's important to understand the limitations of your measurement methodology.
Next Up
We can now see that our system has a certain throughput and latency profile. But if we find a performance problem—a high tail latency or low throughput—how do we find out why? In the next lesson, we will learn how to use Go's built-in profiler, pprof, to look inside our running application, identify CPU hot spots, and analyze memory usage.